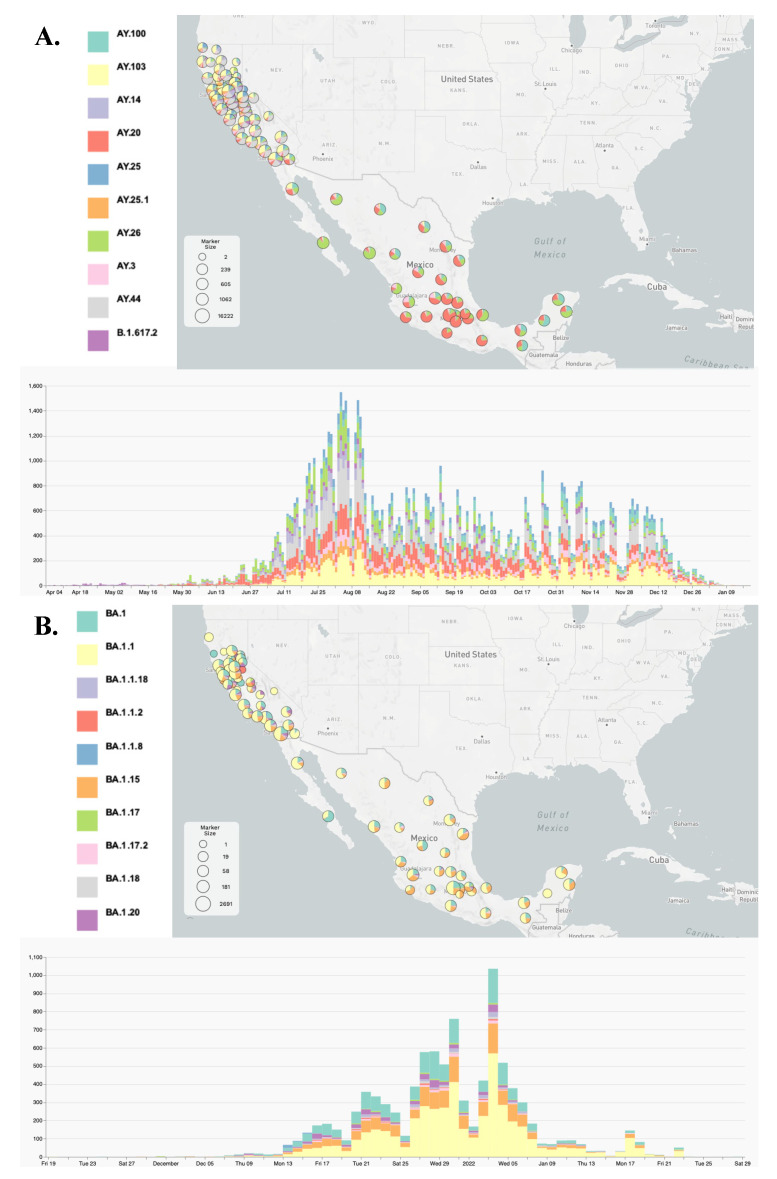
Figure 1.
Visualization of the ten most prevalent Delta (A) and Omicron (B) genomes using MicroReact. MicroReact [15] display of the geolocation of the ten most prevalent genomes with associated lineage inferred by the Pangolin assignment tool [18]. See also Supplementary Figure S4 and MicroReact projects https://microreact.org/project/rqnwd9nymcvdkvq1dktbfj and https://microreact.org/project/d5mbblhkwgxctofu6wdtxt for all circulating Delta and Omicron sub-variants, respectively.

