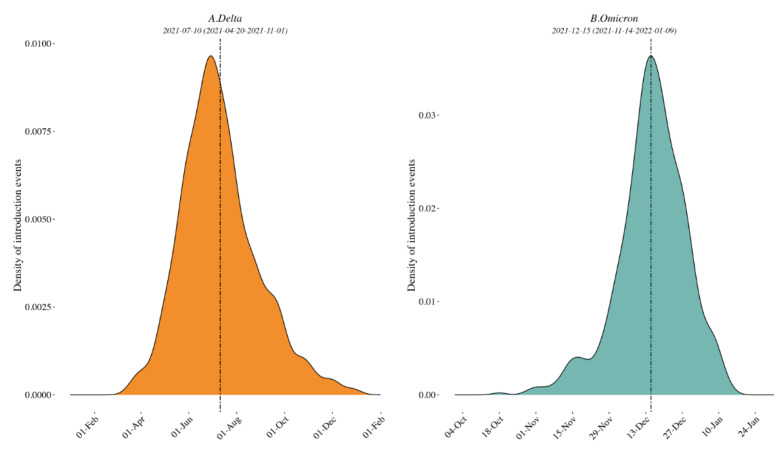
Figure 2.
Density plots of external introduction of the identified clades for Delta (A) and Omicron (B) variants. A normal distribution was specified for the evolutionary rate with a mean of 9.41 × 10⁻⁴ nucleotide substitutions per site per year and a standard deviation of 4.99 × 10⁻⁵ [7]. All 10 replicates are combined to show the timing of the introductions of the clades in the region. See also Supplementary Figure S5 for the results of each of the 10 individual replicates.

