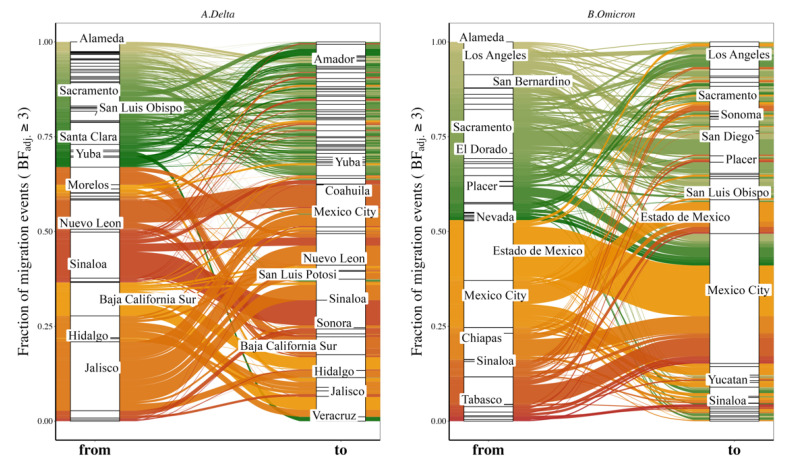
Figure 4.
Proportion of viral migration events from each source location (‘from’) toward the recipient location (‘to’) for Delta (A) and Omicron (B) variants. The Sankey plot shows the proportion of viral migration events from each source location (Californian county or Mexican state) toward the recipient location. Left side of the plot shows the source location (‘from’) and right side of the plot shows the destination location (‘to’). We only report migration events associated with an adjusted Bayes factor (BFadj) ≥ 3. See also Supplementary Figure S7 for results of each of the 10 individual replicates. Locations accounting for ≥ 2% of all events are labeled.

