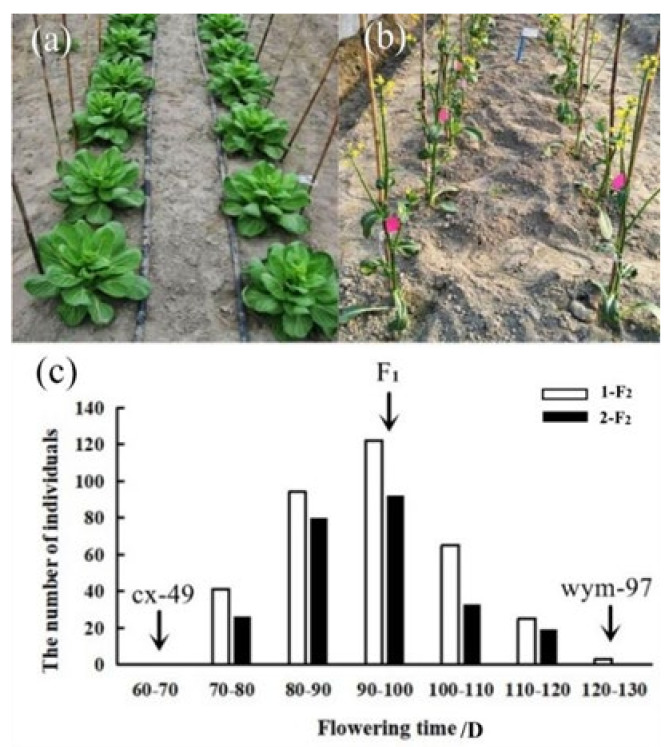
Figure 1.
The flowering time characteristics and frequency distribution of the parent lines, F1 and the F2 populations. (a,b) The performance of the parent lines (80 d after sowing). (c) The frequency distribution of the flowering time of the cx-49, wym-97, F1, 1-F2, and 2-F2 populations. The flowering time of the two parents and F1 is indicated by arrows.

