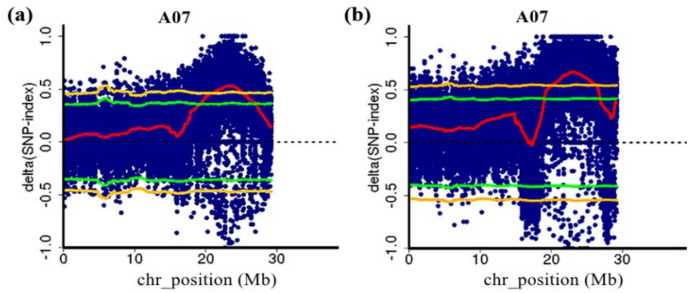
Figure 2.
The major QTL ft7.1 for the flowering time detected by QTL-seq. (a) QTL-seq analysis of chromosome 7 in the 1-F2 population; (b) QTL-seq analysis of chromosome 7 in the 2-F2 population. The blue dots are the Δ(SNP-index) of each SNP, and the red lines are the Δ(SNP-index) fitting lines, Δ(SNP-index) plot of the E and L bulks with confidence intervals under the null hypothesis of no QTLs (green, p < 0.05; yellow, p < 0.01).

