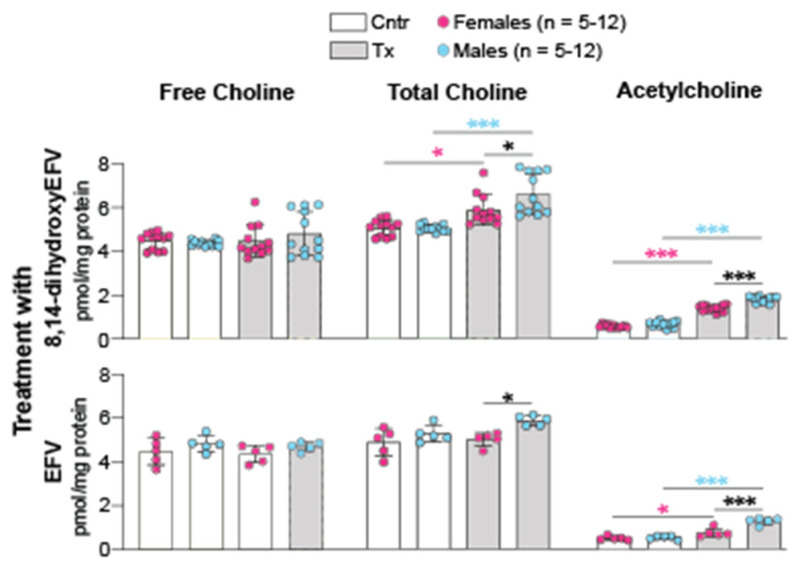
Figure 5.
8,14-DihydroxyEFV and EFV effects on the brain Ach levels. Data represent the mean ± SD of the measurements in individual mice (5–12 female mice and 5–12 male mice). *, p ≤ 0.05; ***, p ≤ 0.001 as assessed by two-way ANOVA with Tukey’s multiple comparison test. The asterisk color indicates significance between female mice (pink), male mice (blue) or male-female animals (black). Cntr, control mice; Tx, treated mice.

