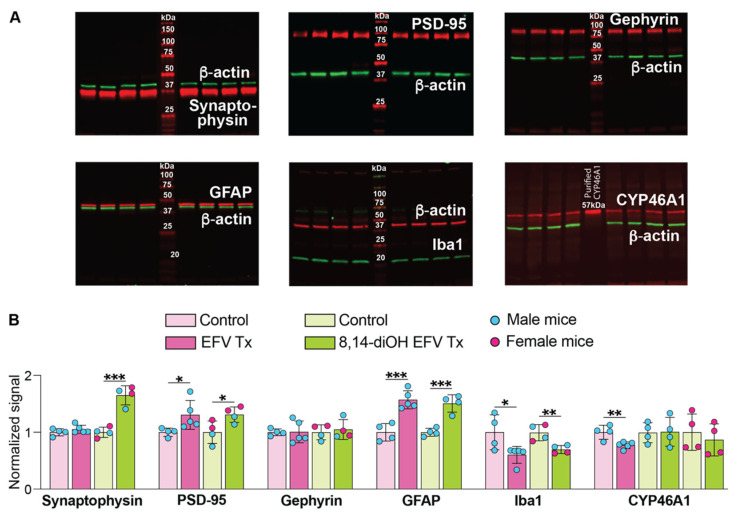
Figure 8.
8,14-DihydroxyEFV (8,14-diOH EFV) effect on brain expression of various marker proteins. (A), Representative Western blots of brain homogenates. Each lane, except those with molecular weight markers, represents a sample from an individual animal. Of the four samples in each group, two left lanes are always samples from male mice and two right lanes are always samples from female mice. The Western blot for CYP46A1 represents expression in male mice only as a similar gel for female mice is not shown, although quantified in the panel below. Also not shown is a Western blot for CYP46A1 when two female and two male mice for each group were used and the data suggested lack of sex-based differences and the treatment effect. (B), Quantification of the relative protein expression in (A). Protein expression in each sample within a group was first normalized to the β-actin expression followed by the calculation of the mean value of the protein expression within a group. This mean value was then normalized to the mean value of the protein expression in control 5XFAD mice, which was taken as one. The results represent the mean ± SD of the measurements in individual mice. * p ≤ 0.05; ** p ≤ 0.01, *** p ≤ 0.001 as assessed a two-tailed, unpaired Student’s test. Data for protein expression of EFV-treated mice are shown for comparison and are taken from [7].

