Figure 5.
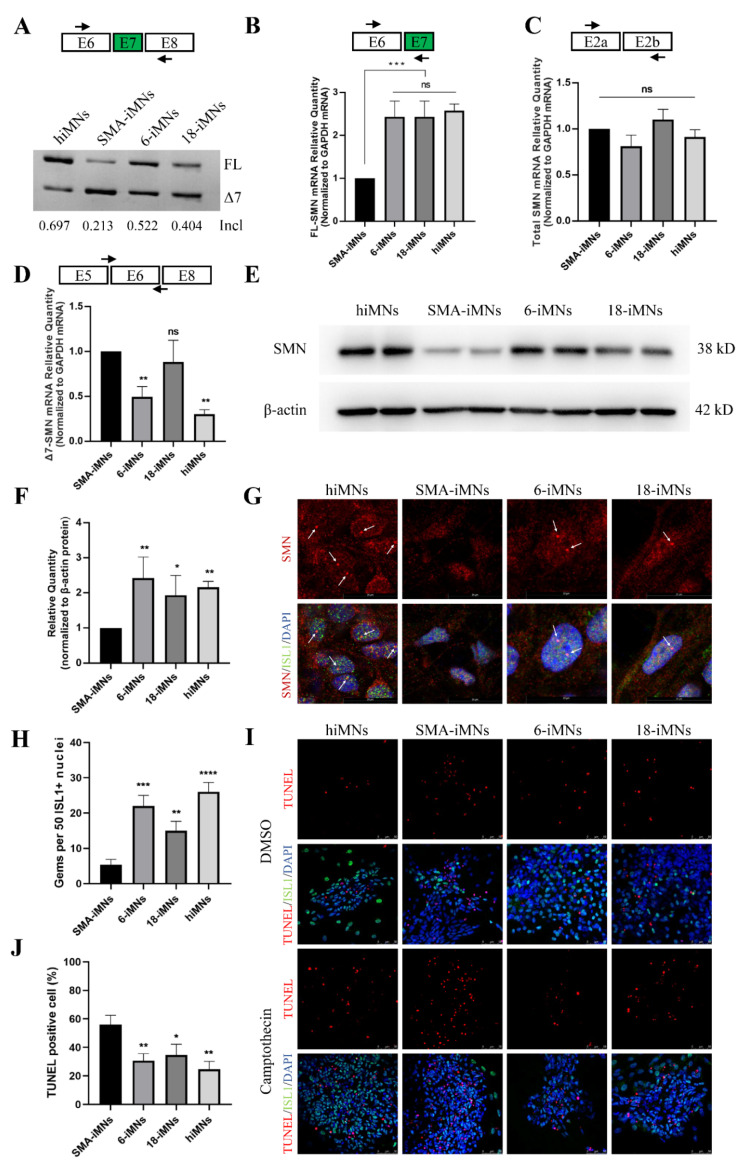
SMN expression in iMNs. (A) RT-PCR analysis of SMN2 mRNA in iMNs at day 28. (B–D) qRT-PCR analyzed the expression of FL-SMN, Δ7-SMN, and total SMN mRNA in iMNs. GAPDH was used as the internal reference. Bars represent the mean ± (SEM); n = 3. Ns, not significant. ** p < 0.01. *** p < 0.001. (E) The SMN protein expression levels in hiMNs, SMA-iMNs, and targeted-deletion iMNs (6-iMNs and 18-iMNs). β-actin was used as the internal reference. (F) Values for each iMNs were normalized to β-actin protein levels. Data shown indicate mean ± SD. * p < 0.05. ** p < 0.01. (G) Immunostaining of SMN in iPSCs derived iMNs. The red fluorescence showed SMN protein, and the gems were pointed out with white arrows. The green fluorescence indicated ISL1. DAPI was used to visualize the nucleus. ISL1, ISLET1. (H) The number of gems detected was higher in the hiMNs, 6-iMNs, and 18-iMNs compared with SMA-iMNs. Data shown indicate mean ± SD. ** p < 0.01. *** p < 0.001. **** p < 0.0001 (I) MNs were treated with DMSO or 10 μM camptothecin for 21 h and assayed with TUNEL to mark apoptotic cells. DAPI was used for nuclear staining. ISL1, ISLET1. (J) Quantification of TUNEL positive iMNs to total cells after camptothecin treatment. Data shown indicate mean ± Sd. n = 3. * p < 0.05. ** p < 0.01.

