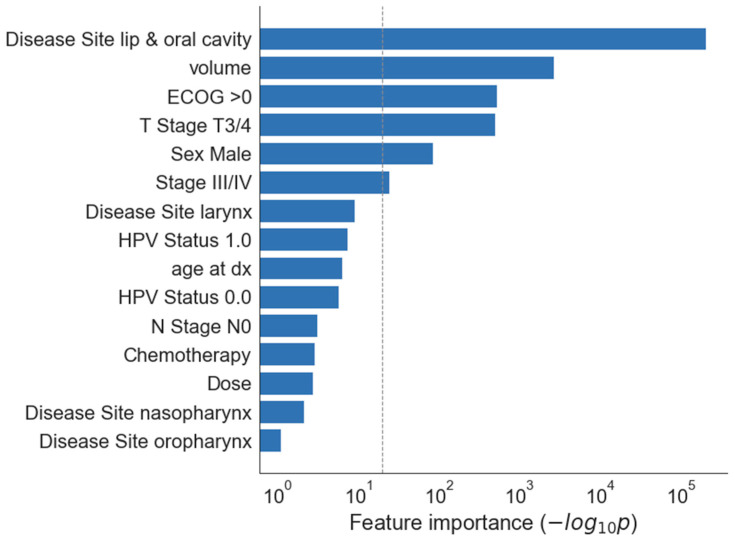
Figure 1.
Univariate feature importance for clinical variables. The horizontal axis shows feature importance as the negative log of univariate p value (F-test), so that longer bar indicates a feature more significantly associated with the outcome. The dashed grey line indicates p = 0.05. Volume-GTV primary volume, Chemotherapy—yes, Dose—radiotherapy dose delivered, HPV status-1.0—positive, 0.0—negative.

