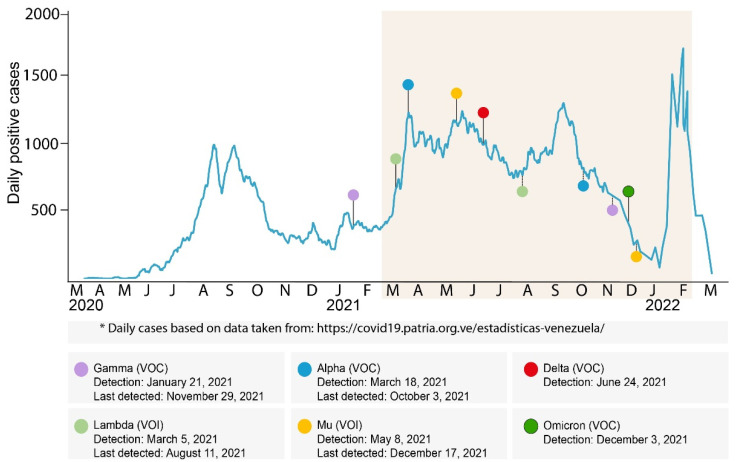
Figure 1.
Timeline of cases and detection of VOIs and VOCs in Venezuela. The curve displays the number of COVID-19 cases reported for each day since the first case was detected in Venezuela. The colored shadow corresponds to the period studied. Upper circles represent the date of the first detection for each variant, and lower circles the date of the last detection. The date of the first and the last detection for each variant is based on a complete genome or a partial genome sequence. The date of the first detection of the Gamma VOC was reported previously [21].

