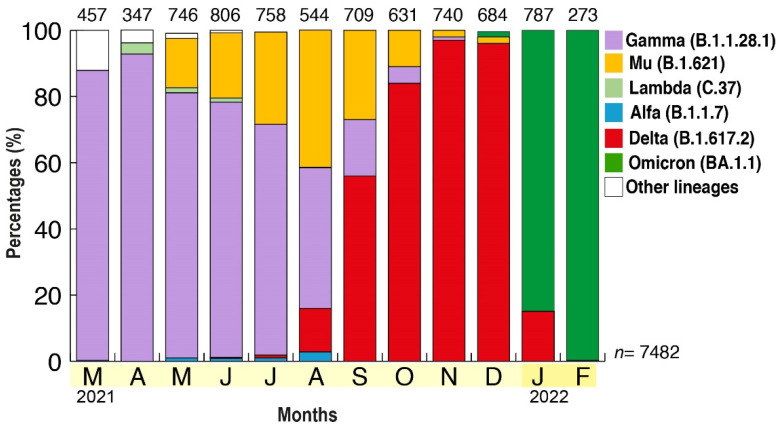
Figure 2.
Prevalence of the different VOIs and VOCs in Venezuela from March 2021 to February 2022. The frequency of VOC is shown according to the month of collection of samples in the country. The average frequency was obtained by multiplying the frequency of variants by the population for each state, and then adjusting to 100% if not all the states were tested (see Supplemental Figure S1). The number above each bar refers to the number of samples analyzed each month, n = 7482 being the total number of samples analyzed.

