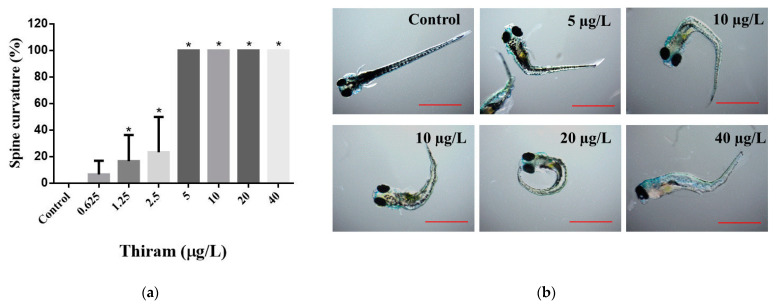
Figure 2.
Spine curves of zebrafish induced at designated doses of thiram. (a) Graph shows the percentages of spine curves scored at 144 hpf. Data shown as mean ± SD were obtained from six plates (three independent experiments). Statistical differences were analyzed using an unpaired t-test; * p < 0.05. (b) Representative images showing thiram-induced spine curves at 144 hpf. Scale = 1.0 mm.

