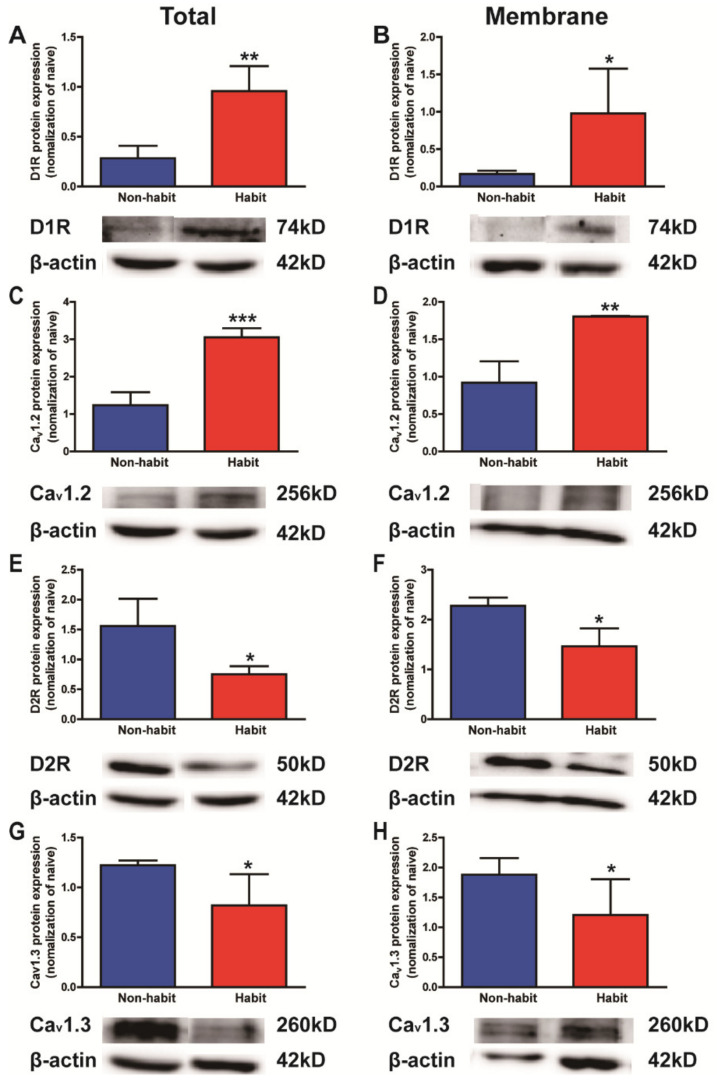
Figure 2.
The total and membrane protein levels of D1Rs vs. D2Rs, Cav1.2 vs. Cav1.3 in the Put. (A) The total protein level of D1Rs in the Put was higher in the habit tree shrews than in the non-habit animals. (B) The membrane protein level of D1Rs in the Put was higher in the habit tree shrews than in the non-habit animals. (C) The total protein level of Cav1.2 in the Put was higher in the habit tree shrews than in the non-habit animals. (D) The membrane protein level of Cav1.2 in the Put was higher in the habit tree shrews than in the non-habit animals. (E) The total protein level of D2Rs in the Put was lower in the habit tree shrews than in the non-habit animals. (F) The membrane protein level of D2Rs in the Put was lower in the habit tree shrews than in the non-habit animals. (G) The total protein level of Cav1.3 in the Put was lower in the habit tree shrews than in the non-habit animals. (H) The membrane protein level of Cav1.3 in the Put was lower in the habit tree shrews than in the non-habit animals. * p < 0.05, ** p < 0.01, *** p < 0.001; habit group vs. non-habit group. The data were expressed as the means ± SEM and analyzed with t-test, habit group n = 3, non-habit group n = 4.

