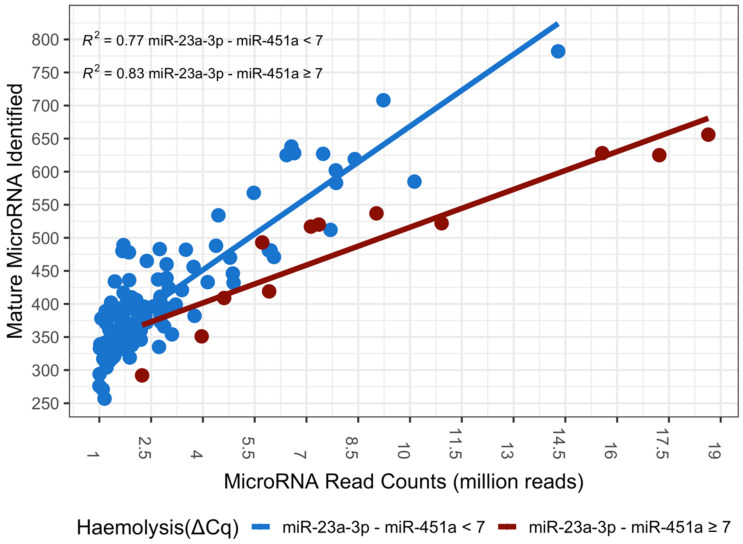
Figure 1.
The number of mature miRNA species identified in an individual sample increases with read depth for both haemolysed (dark red) and non-haemolysed (blue) samples. However, the number of mature miRNA species identified for a given read depth is significantly lower (ANOVA, p-value = 1.68 × 10⁻⁹) in samples affected by haemolysis when compared to a non-haemolysed sample of equal read depth (n = 121).

