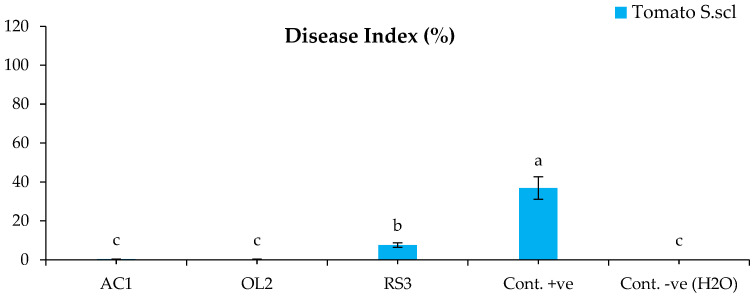
Figure 1.
Disease index of tomato inoculated with S. sclerotiorum. Bars with different letters indicate mean values significantly different at p < 0.05 according to Tukey’s B test. Data are expressed as mean of 3 replicates ± SDs. DI (%) = [Σ (Scale × No. of SL)/(HS × TL)] × 100 (Equation (1)). AC1, OL2, and RS3 are Streptomyces sp., Arthrobacter humicola, and Streptomyces atratus, respectively.

