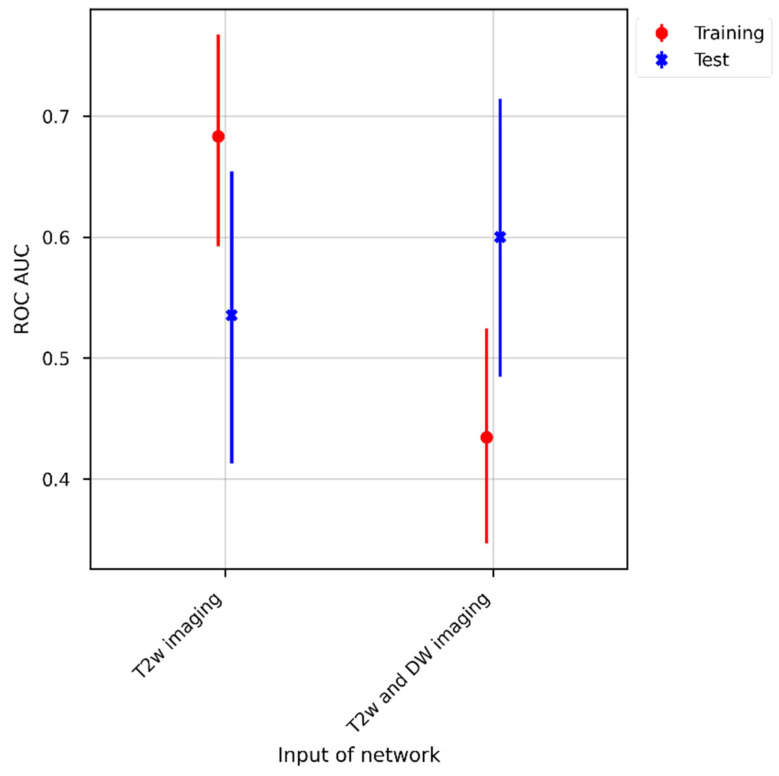
Figure 4.
The area under the receiver operating characteristic curve (AUC) was calculated for the different receiver operating characteristic curves depicted in Figure 3. The AUCs are shown for the training (colored red) and test cohorts (colored blue). For the training cohort, classification with only T2w images as inputs performed significantly better than with T2w and DW images.

