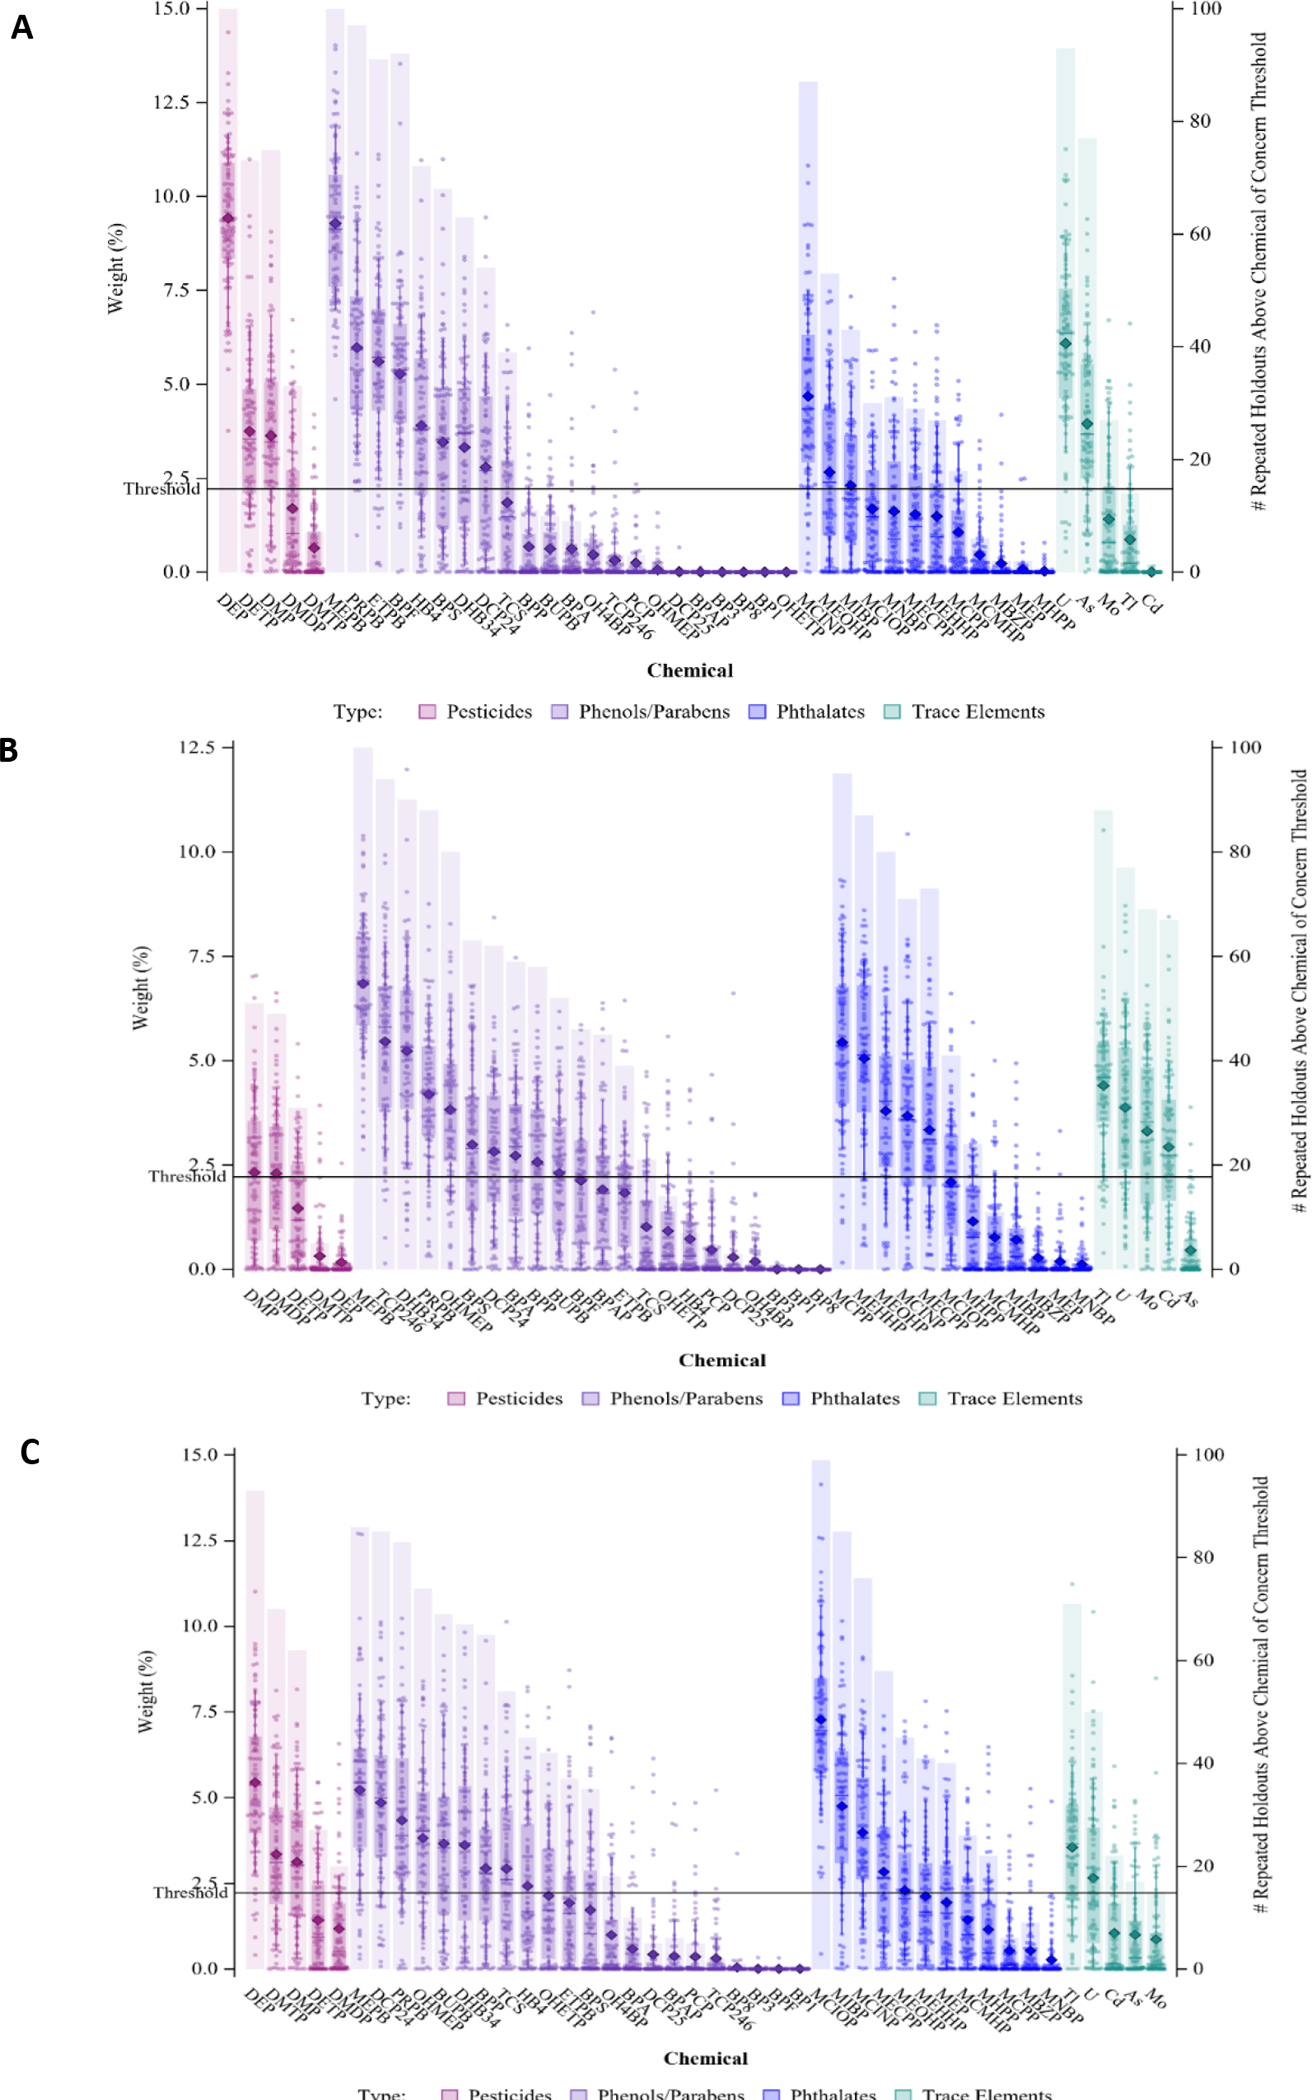
Figure 4:

Weight distributions of each chemical from each 100 repetitions (left axis) and the number of repetitions in which the chemical exceeded the 1/c threshold contribution of concern (4.54%; right axis) for total mixture multinomial WQS models with more than 90% repititions above the null, where weights associated with ASD are shown in A, DD are shown in B, and OEC are shown in C.
