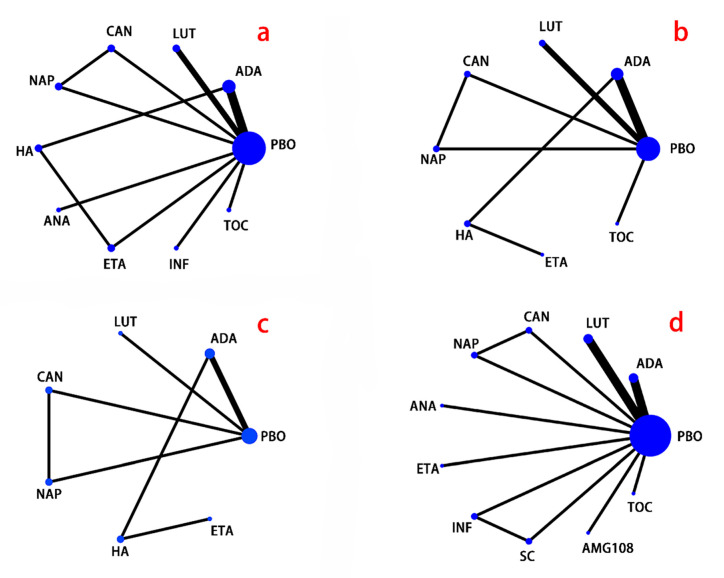
Figure 2.
Network plot. (a), pain; (b), physical function; (c), stiffness; (d), adverse events; PBO, placebo; ADA, adalimumab; LUT, lutikizumab (ABT981); CAN, canakinumab; NAP, naproxen; HA, hyaluronic acid; ANA, anakinra; ETA, etanercept; INF, infliximab; SC, standard care; TOC, tocilizumab. The size of the circle represents the number of participants, and the thickness of the line represents the number of studies.

