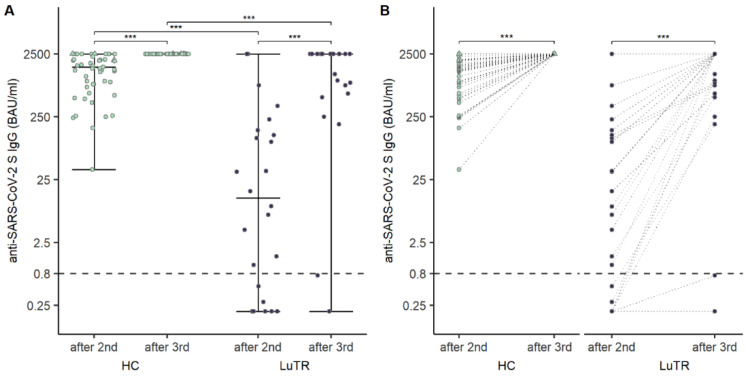
Figure 3.
Humoral response in LuTRs and in HCs 4 weeks after the second and the third dose of vaccination: SARS-CoV-2 S antibody levels (BAU/mL) (A), and change in SARS-CoV-2 S antibody levels (BAU/mL) after second and third immunization (B). The horizontal lines indicate the cutoff for seroconversion. Circles represent individual antibody titers. Participants with a history of COVID-19, prior to immunization, are presented as triangles. Darker lines indicate overlapping points. (*** significant).

