
Figure 2: Graphs showing correlation between total and individual fatty acid ethyl ester (FAEE) concentrations and serum parameters during alcohol intoxication.
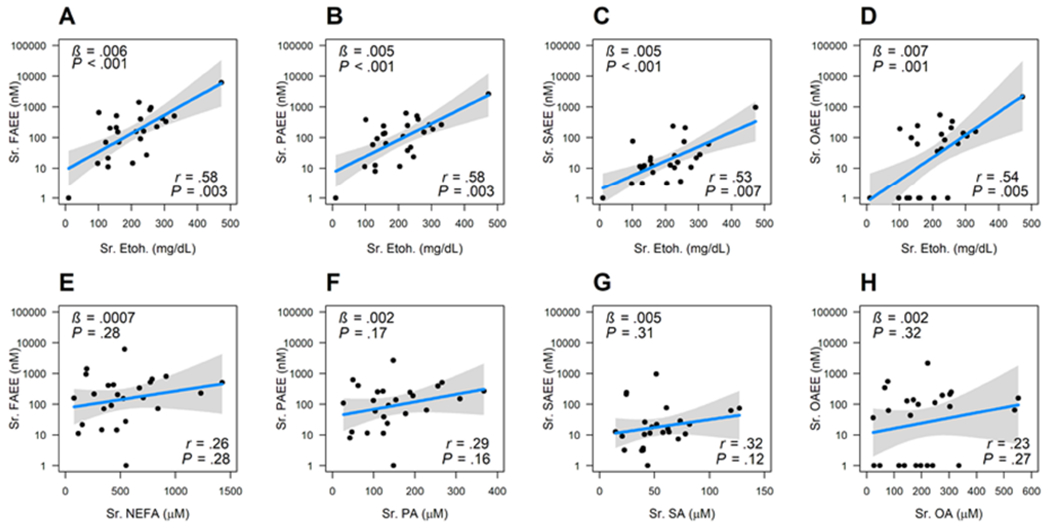
A-D show relation of blood ethanol (Etoh; on the x-axis), with total FAEE in A, palmitic acid ethyl ester (PAEE) in B, stearic acid ethyl ester (SAEE) in C, and oleic acid ethyl ester (OAEE) in D. E-H show the relationships with total non-esterified fatty acid (NEFA) in E, with Palmitic acid (PA) in F, with Stearic acid (SA) in G, with Oleic acid (OA) in H. The variable on the y-axis is treated as a dependent variable and the variable in the x-axis is treated as an independent variable. All the y-axes are plotted in logged scale with base 10. Black dots are the actual data; blue lines are the slope from the linear regression, and gray band shows the 95% confidence interval. At the bottom right are shown the correlation coefficients (r), along with the p values. On the upper left are the slope (β) of the regression line and p value are shown on the left upper corner.