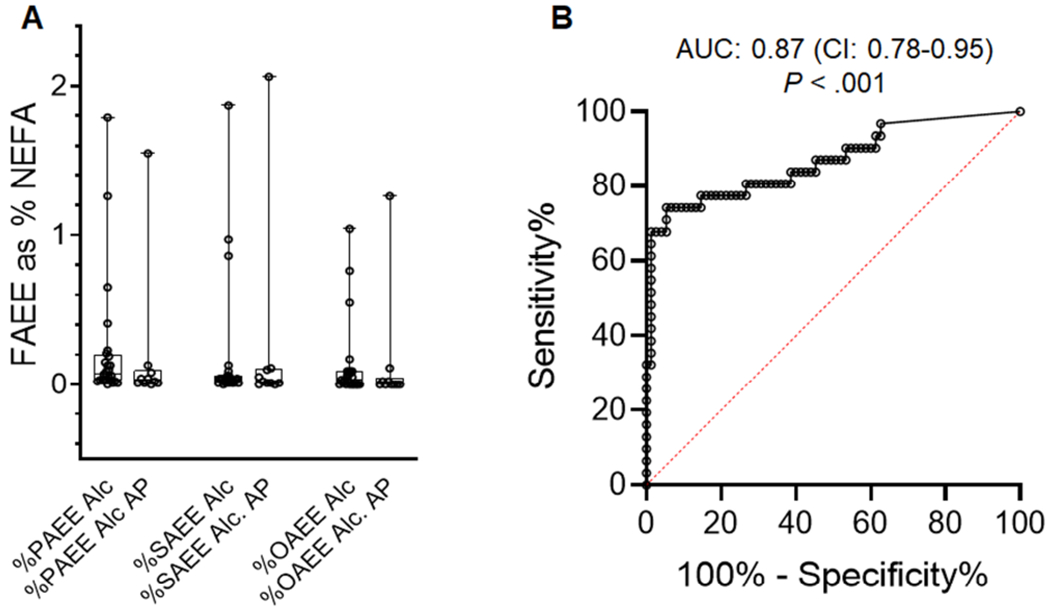
Figure 4: Serum FAEE concentrations as a proportion of NEFA, and the diagnostic accuracy of serum FAEEs for alcoholic pancreatitis.

A) Concentrations of FAEEs as percentage of parent NEFA are shown as box plots. The boxes show the interquartile range and error bars show the range. Values for each individual patient are shown as circles. Ale; Alcohol intoxication, Ale AP; Alcoholic acute pancreatitis. The error bars depict SD, and * indicate a P <0.05 between OA and OAEE on Student’s t-test. B: Receiver operating characteristic (ROC) curve for serum FAEEs to diagnose alcoholic pancreatitis. ROC was performed for serum FAEE concentrations (nM) (n=106 acute pancreatitis patients, with 31 having a diagnosis of alcoholic pancreatitis). Area under the curve (AUC) for FAEE was 0.87, with a P<.001)
