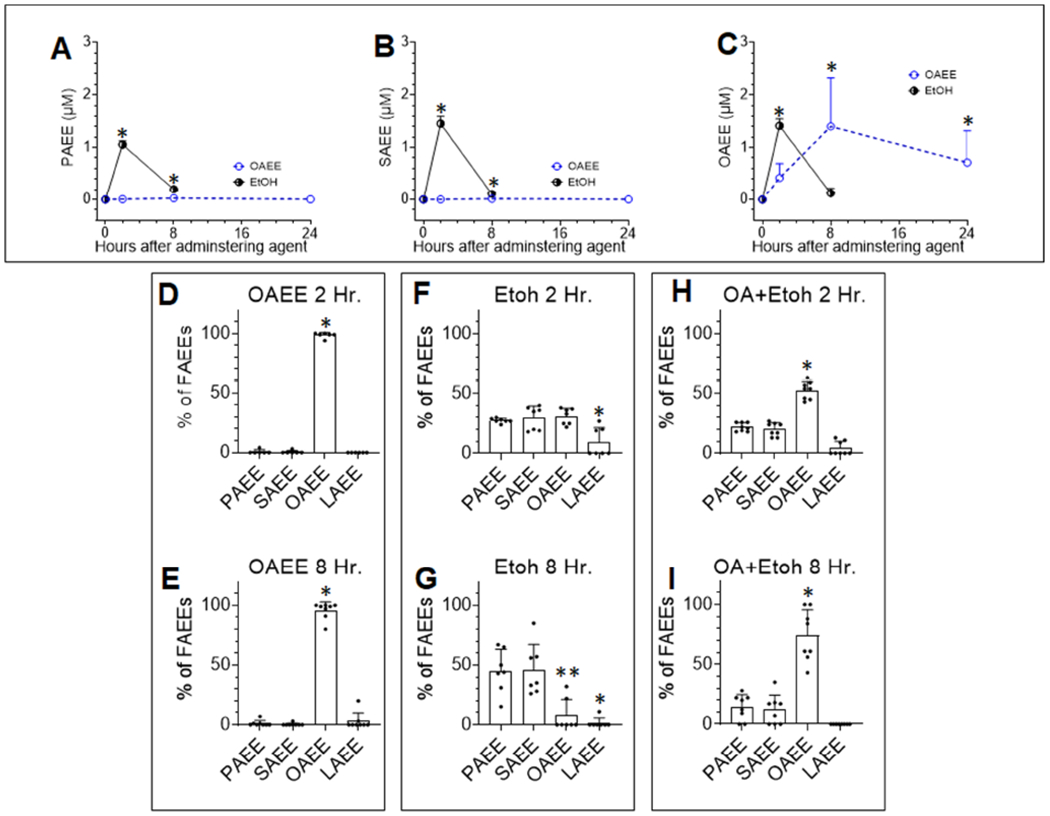
Figure 5: FAEE levels in the sera of mice given alcohol, oleic acid, or its ethyl ester.

A-C: Time course of FAEE elevation in mice given 2.2gm/Kg ethanol (Etoh; black line) or 4.0 gm/Kg oleic acid ethyl ester (OAEE; dashed blue line). Shown are A: Serum PAEE, B: Serum SAEE, C: Serum OAEE. The “*” indicates a P value <.05 vs. values in control mice (time zero) using a Mann-Whitney or Student’s t-test depending on normality of distribution. Error bars are standard error of mean. Bar graphs showing proportions of the 4 principal ethyl esters in the sera of mice given OAEE (D, E), ethanol (F, G) or ethanol with oleic acid 0.3% body weight(H, I) at 2 and 8 hours. The value for each mouse is shown as an individual point. The error bars are standard deviation, * indicates a p<0.05 on ANOVA vs. other ethyl esters. In case of E, the ** indicates significantly lower values for OAEE than PAEE or SAEE.
