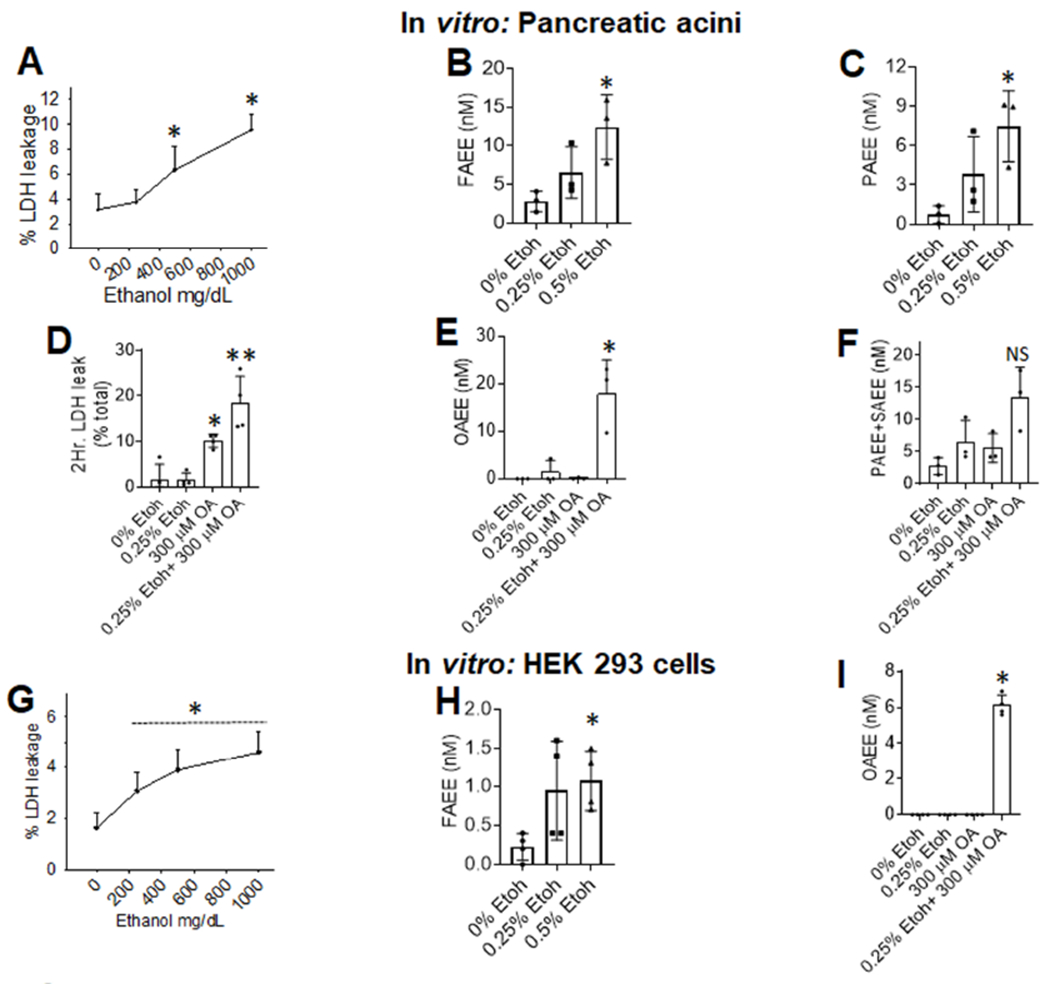
Figure 6: cell injury and FAEE generation from cells exposed to ethanol and/or the parent NEFA:

A: Dose response of ethanol induced LDH leakage from acini with line depicting the mean. Bar graphs of FAEE (B) or PAEE (C) concentrations in the medium. Bar graphs comparing the effect of 0.25% ethanol on 300μM OA induced LDH leakage (D) Levels of OAEE (E) or other FAEEs (F) in the medium. G: Dose response of ethanol induced LDH leakage from HEK 293 cells. Bar graphs of total FAEE (H) concentrations in the medium at different ethanol concentrations. Bar graphs comparing the effect of 0.25% ethanol on 300μM OA induced changes in OAEE concentrations (I) in the medium. Each experiment was done 3-4 times, with each point representing an average of duplicates collected at 2 or 4 hours, unless specified on the graph. Each. The error bars depict SD, and * indicate a P <0.05 vs. control (0% ethanol) on ANOVA. NS means not significant.
