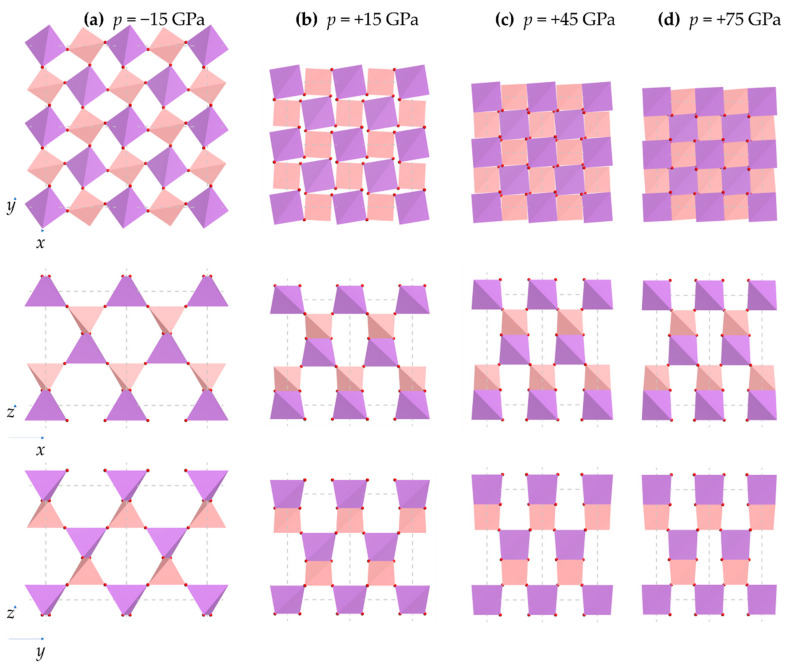
Figure 5.
Images of the systems at various extents of applied pressure (a) −15 GPa, (b) +15 GPa, (c) +45 GPa, and (d) +75 GPa, with changes in the crystal structure being very evident. These changes are also very evident by the differences in reflections/peak positions in the PXRD patterns, see Appendix B.

