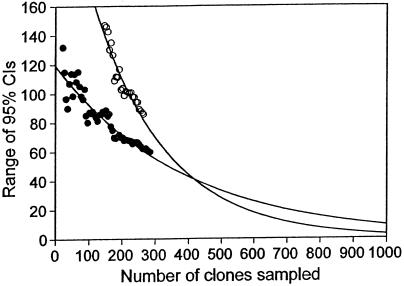
FIG. 5.
Average size of the 95% CIs of Chaol estimates for bacteria in the human mouth (○) and gut (●) as sample size increases. These CIs are the same as in Fig. 4, but only the decreasing portions of the CIs are plotted. The curves are fitted negative exponential curves [mouth, f(x) = 270e−0.0046x, r2 = 0.90; gut, f(x) = 120e−0.0026x, r2 = 0.87].

