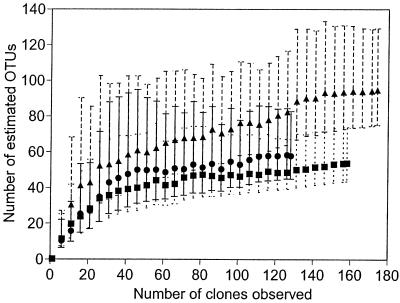
FIG. 7.
Chaol estimates of bacterial OTU richness in low- (■), intermediate- (●), and high- (▴) productivity ponds. Error bars are 90% CIs and were calculated with the variance formula derived by Chao (8). The dotted, solid, and dashed bars are error bars for the low-, intermediate-, and high-productivity mesocosms, respectively.

