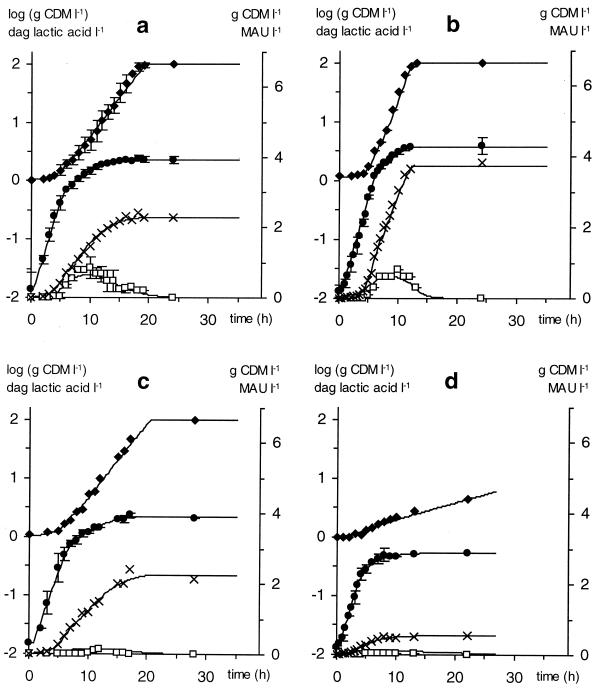
FIG. 3.
Cell growth (×, in grams of CDM per liter; ●, in log [grams of CDM per liter]), lactic acid production (♦, in decagrams per liter), and bacteriocin activity (□, in MAU per liter) for L. sakei CTC 494 in standard MRS broth (a), MRS broth with a double complex nutrient concentration (b), MRS broth with 20 g of NaCl liter−1 (c), and tryptone broth (d). All fermentations were carried out at a controlled temperature of 30°C and pH 6.5. Data points in panel a represent the mean of four repeats. Full lines are according to the model.

