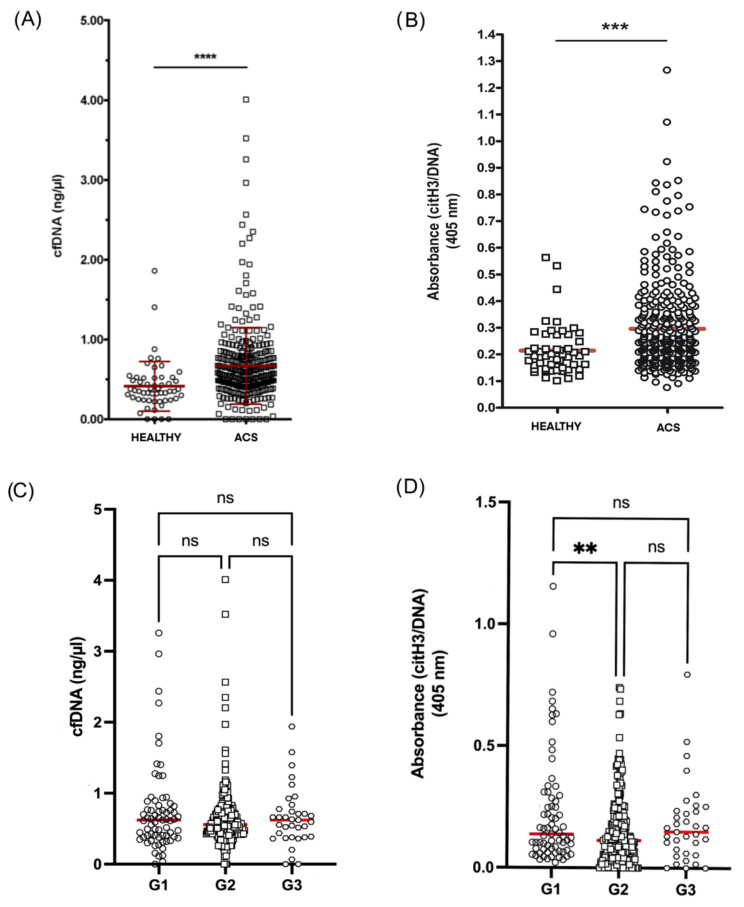
Figure 1.
Levels of NETosis markers in ACS young patients. (A) cfDNA levels in healthy donors (n = 55) vs. ACS patients (n = 342) measured by Sytox Green fluorescence. (B) citH3–DNA complexes in healthy individuals (n = 51) vs. ACS patients (n = 343) measured by ELISA and expressed as relative absorbance at 405 nm. (C) cfDNA levels by group of ACS patients (G1 n = 69; G2 n = 238; G3 n = 35). (D) citH3–DNA complexes expressed as relative absorbance at 405 nm in the different groups of ACS patients (G1 n = 69; G2 n = 239; G3 n = 35). ns: not significant; ** p < 0.01; *** p < 0.001; **** p < 0.0001.

