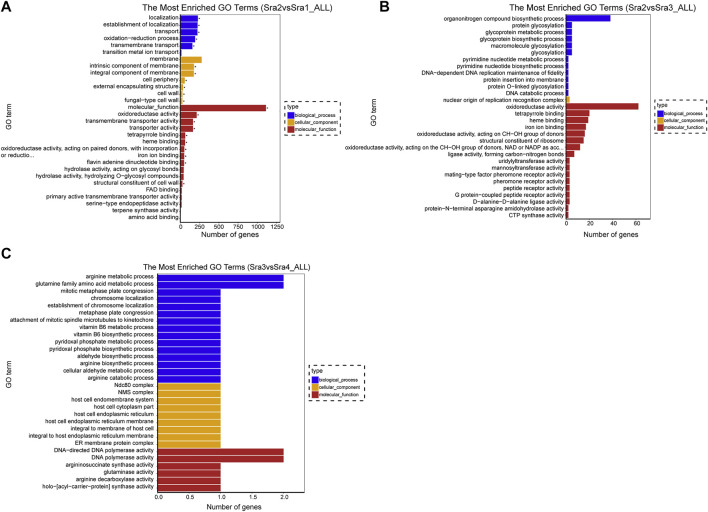
FIGURE 2.
GO classification of DEGs. (A–C) GO enrichment histogram of three PCGs. (A) Sra1 vs. Sra2 PCG; (B) Sra2 vs. Sra3 PCG; and (C) Sra3 vs. Sra4 PCG. The vertical axis was the name of the enriched GO term, and the horizontal axis was the number of DEGs in the corresponding term. Different colors were used to distinguish biological processes, cell components, and molecular functions, and “*” represented a significantly enriched GO term.

