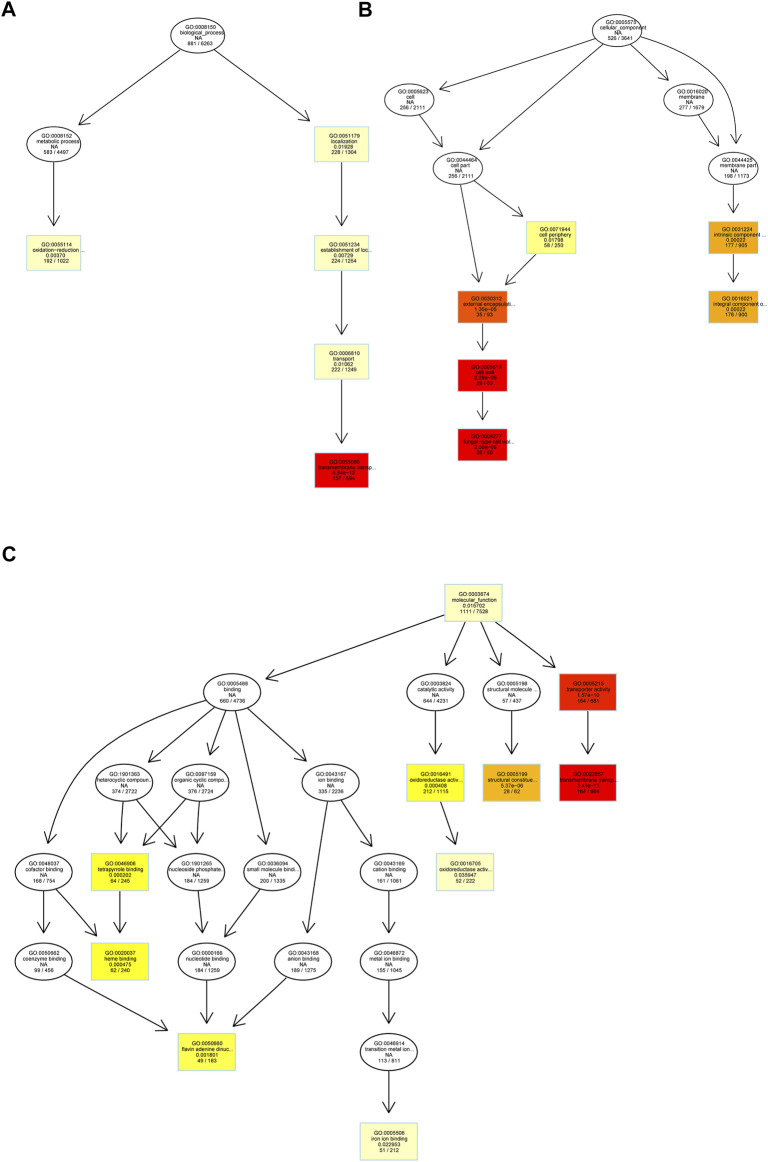
FIGURE 3.
Directed acyclic graph of the top GO terms in Sra1 vs. Sra2 PCG. (A) Biological process; (B) cell component; and (C) molecular function. Each node represents a GO term, and the contents displayed on each node from top to bottom are as follows: GO term ID, description, p value after correction, and the number of DEGs under the GO term. The depth of color represents the degree of enrichment, and the darker the color, the more significant the degree of enrichment.

