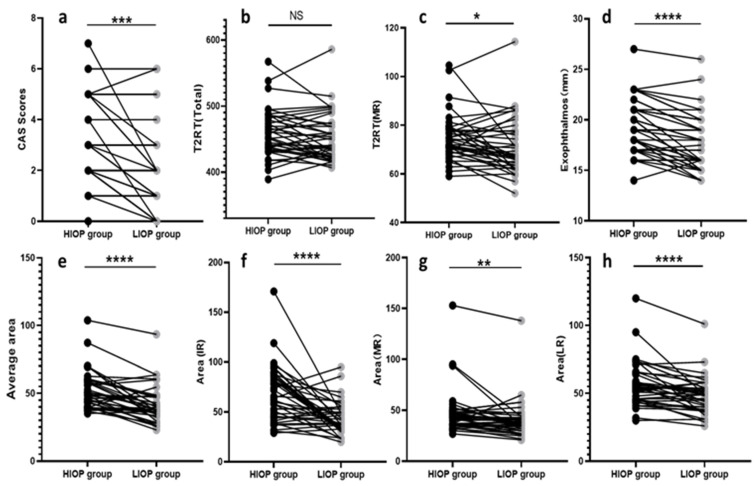
Figure 2.
Wilcoxon signed-rank test charts show the differences of the CAS score (a), the overall orbital T2 relaxation time—T2RT (Total) (b), the medial rectus muscle T2 relaxation time—T2RT(MR) (c), exophthalmos (d), the average extraocular muscle cross-sectional area—average area (e), the inferior rectus cross-sectional area-area (IR) (f), the medial rectus cross-sectional area—area (MR) (g), and the lateral rectus cross-sectional area—area(LR) (h) between the HIOP and LIOP groups. CAS, clinical activity score; T2RT, T2 relaxation time; MR, medial rectus; IR, inferior rectus; LR, lateral rectus; HIOP, high intraocular pressure; LIOP, low intraocular pressure; NS, not statistically different; * p < 0.05; ** p < 0.01; *** p < 0.001; **** p < 0.0001.

