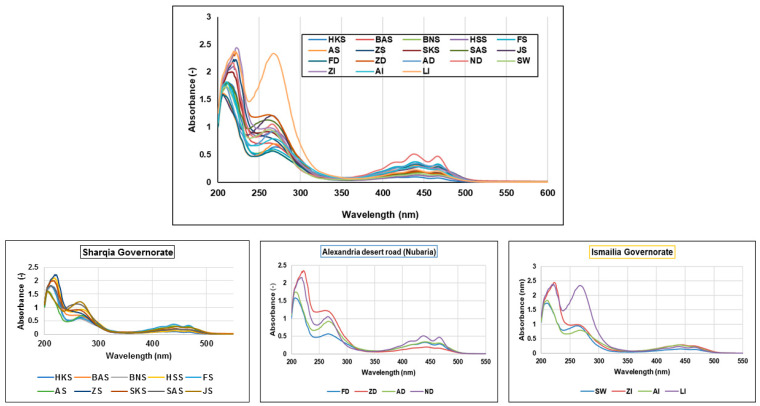
Figure 2.
UV/Vis spectra of different mango fruits showing similar behavior mostly attributed to phenolic compounds, except that LI and ND samples showed prominent peaks of phenolic acids at ca. 270 nm and β-carotene between 400 and 500 nm, respectively. Three sub-figures were designed to show the fine differences between mango fruits based on geographical origin. The sample codes are listed in Table 1.

