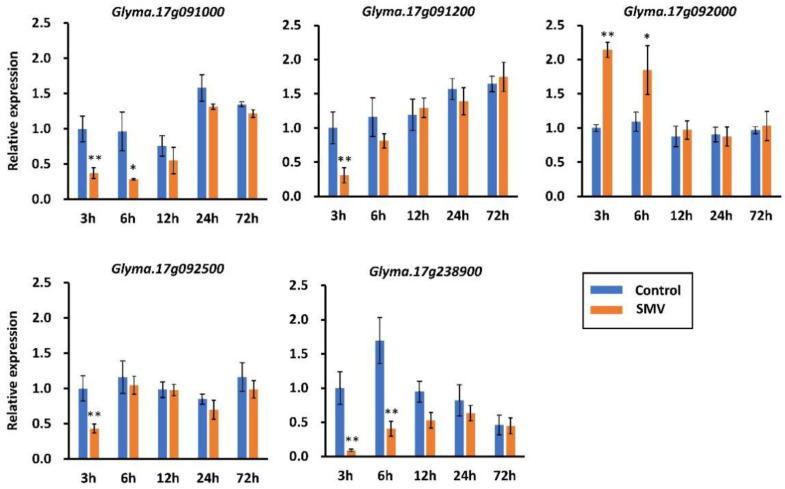
Figure 4.
Expression profiling of candidate genes for resistance to seed coat mottling in soybean cultivar SN14 in response to SMV N3 strain. The y-axes indicate the relative expression levels between samples infected with SMV and control samples inoculated with PBS buffer; the x-axes indicate the time points post-inoculation; the * and ** indicate significant differences at p < 0.05 and p < 0.01, respectively, based on Student’s two-tailed t-test using SPSS 12.0.

