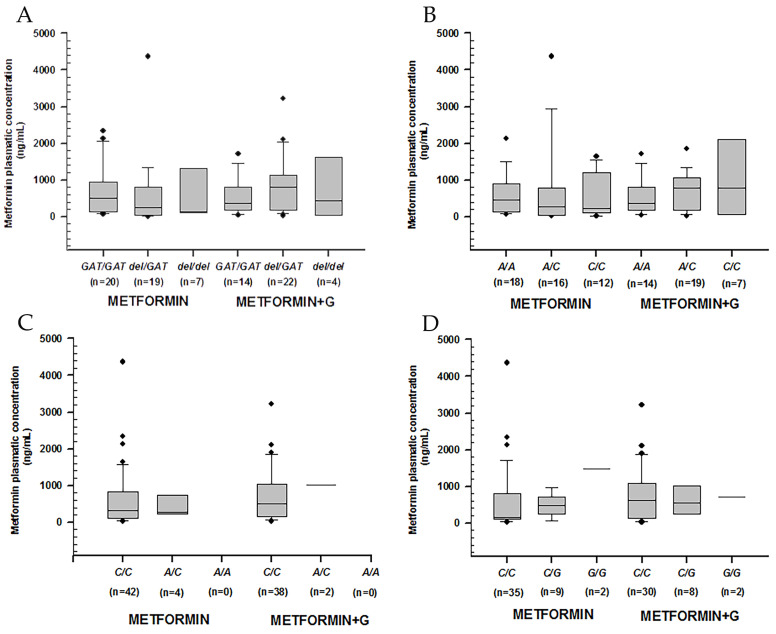
Figure 1.
Metformin plasmatic concentration boxplots (ng/mL), including medians, interquartile ranges, and outliers (filled circles). (A) rs72552763 (OCT1). (B) rs622342 (OCT1). (C) rs316019 (OCT2). (D) rs2076828 (OCT3). Data are sorted according to genotype and treatment type (metformin to the left, metformin + glibenclamide to the right). No statistical difference was found.

