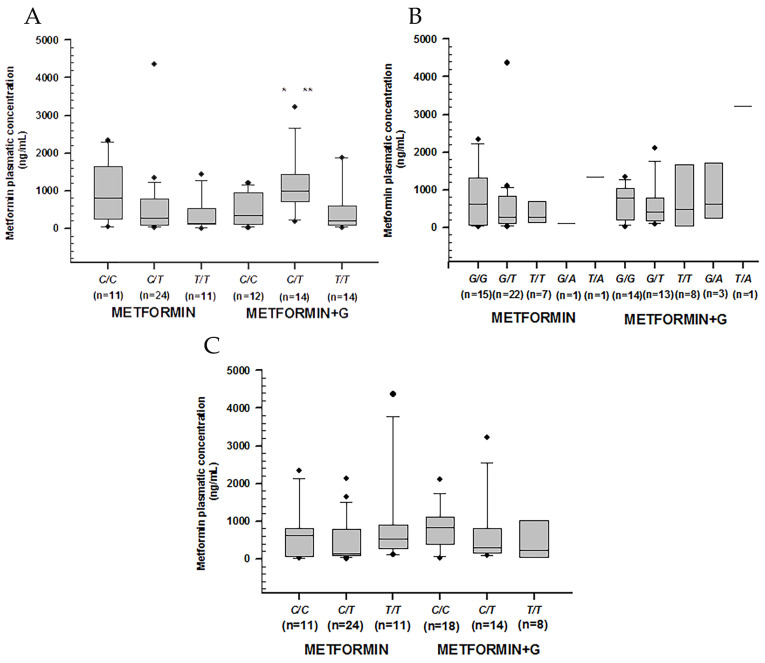
Figure 2.
Metformin plasmatic concentration boxplots (ng/mL), including medians, interquartile ranges, and outliers (filled circles). (A) rs1128503 (ABCB1). (B) rs2032582 (ABCB1). (C) rs1045642 (ABCB1). Metformin to the left, metformin + glibenclamide to the right according to genotype. Only C/T of rs1128503 reported both extra-group (metformin + glibenclamide) (** p = 0.002) and intra-group (metformin) statistical difference (* p = 0.007).

