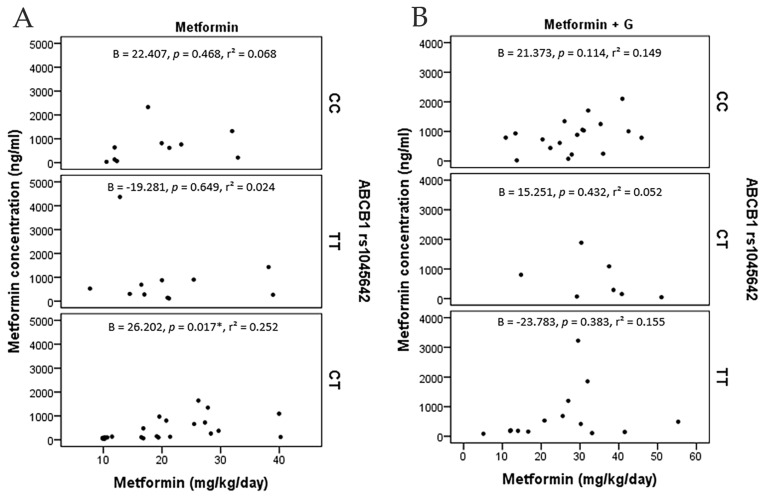
Figure 4.
Metformin concentration points (ng/ml) and metformin dosage (mg/Kg/day), including angular regression coefficient with p value and determination coefficient. (A) metformin monotherapy patients grouped by ABCB1 (rs1045642). (B) metformin+glibenclamide patients grouped by ABCB1 (rs1045642). C/T presents a positive correlation among metformin monotherapy (*: p = 0.017).

