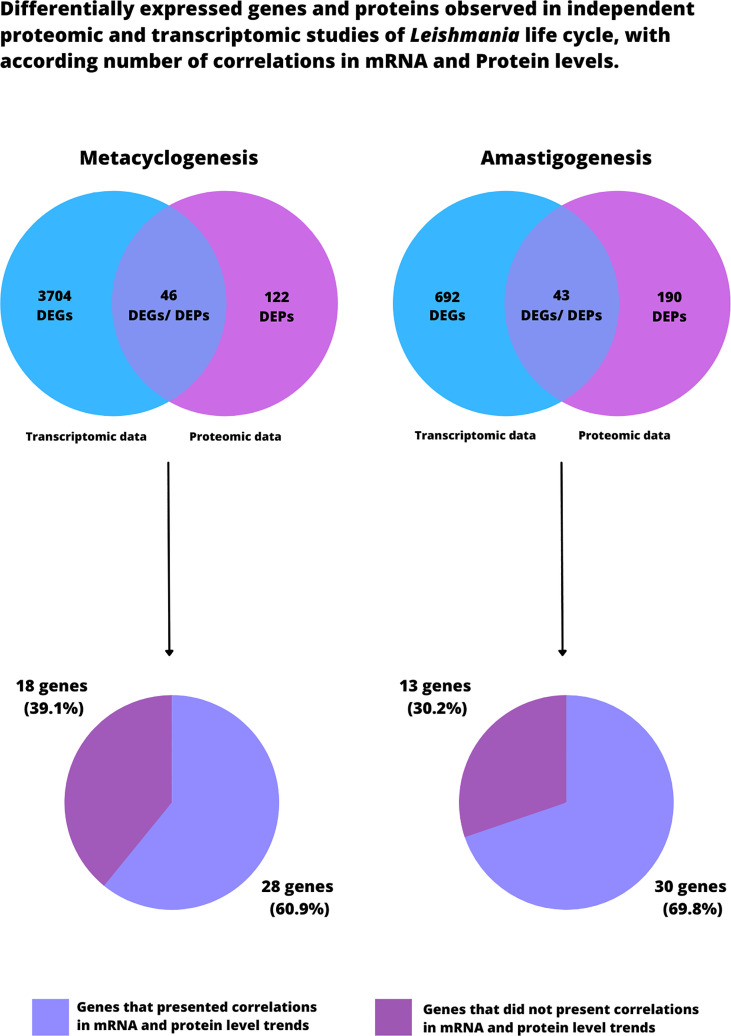
Figure 4.
Differentially expressed genes and proteins observed in independent transcriptomic and proteomic studies of Leishmania life cycle. Both Venn Diagrams on the top portion of the figure describe the total number of DEPs and DEGs found in all the analyzed studies that was based this review. Further, among the commonly differentially expressed genes, we indicate the amount of genes that presented correlation between mRNA and protein levels in metacyclogenesis and amastigogenesis. It is worth noting that these results should be read as proof-of-concept, since no statistical analysis was performed to compare the analyzed studies.

