
Figure 2.
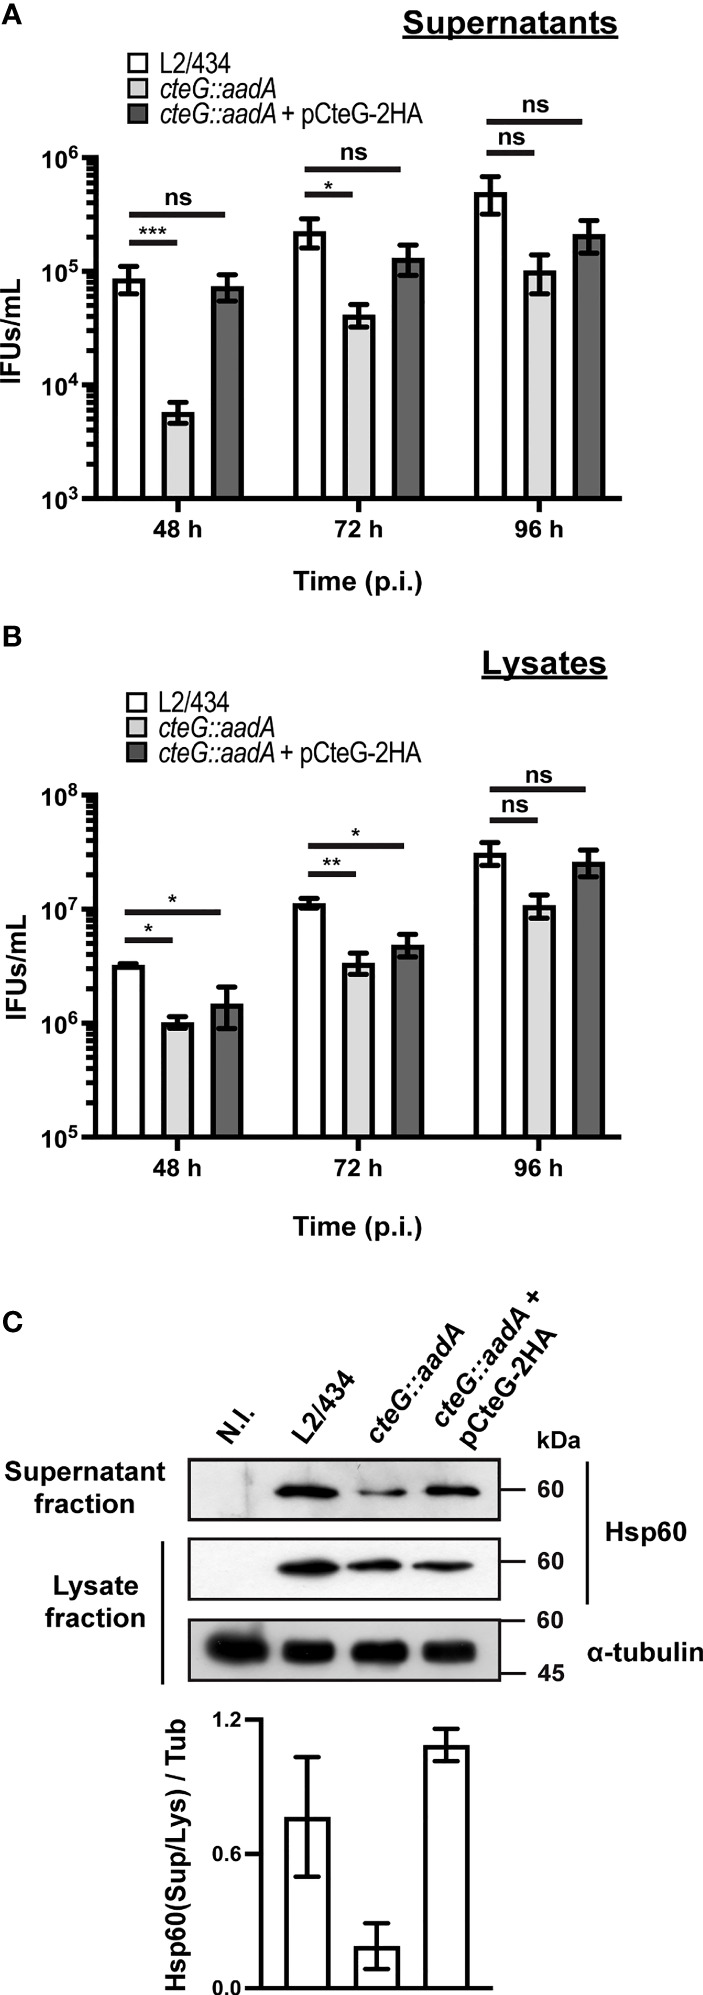
C. trachomatis displays a CteG-dependent defect in egress from infected host cells. HeLa 229 cells were infected with C. trachomatis parental (L2/434), mutant (cteG::aadA), and complemented (cteG::aadA harboring a plasmid encoding CteG-2HA; also named pCteG-2HA[Pgp4+] in Table 1 and in Figures 4 , 5 ) strains at an MOI of 0.06 for 48, 72 or 96 h. At each time post-infection (p.i.), cell supernatants were collected (supernatant fraction) and adherent cells were lysed by osmotic shock to recover intracellular chlamydiae (lysate fraction). Fresh layers of HeLa cells were infected with serial dilutions of both supernatant (A) and lysate (B) fractions to quantify the number of recoverable inclusion-forming units (IFUs/mL). Data correspond to the mean ± standard error of the mean (n≥3). For each time point, statistical significance was determined by using ordinary one-way ANOVA and Dunnett post-test analysis relative to the L2/434 parental strain (ns, non-significant; *p<0.5; **p<0.01, ***p<0.001). For statistical analysis, natural logarithm was applied to data to ensure normality of the populations. (C) HeLa cells were left non-infected (N.I.), or were infected for 48 h with C. trachomatis L2/434, cteG::aadA or cteG::aadA harboring pCteG-2HA (also named pCteG-2HA[Pgp4+] in Table 1 and in Figures 4 , 5 ) at a MOI of 0.06. The proteins in the supernatant fraction (containing extracellular bacteria) were analyzed by immunoblotting with an antibody against C. trachomatis Hsp60 and the lysate fraction (intracellular bacteria) was analyzed by immunoblotting with antibodies against C. trachomatis Hsp60 and human α-tubulin (cell loading control), and using SuperSignal West Pico detection kit (Thermo Fisher Scientific) to detect proteins in the lysate fraction or SuperSignal West Femto detection kit (Thermo Fisher Scientific) to detect proteins in the supernatant fraction. Bands were quantified using Fiji software, and the Hsp60 signal in the supernatant fraction (Sup) was normalized to that in the lysate fraction (Lys) and to tubulin signal (Tub). Bars correspond to mean ± standard error of the mean (n=3).