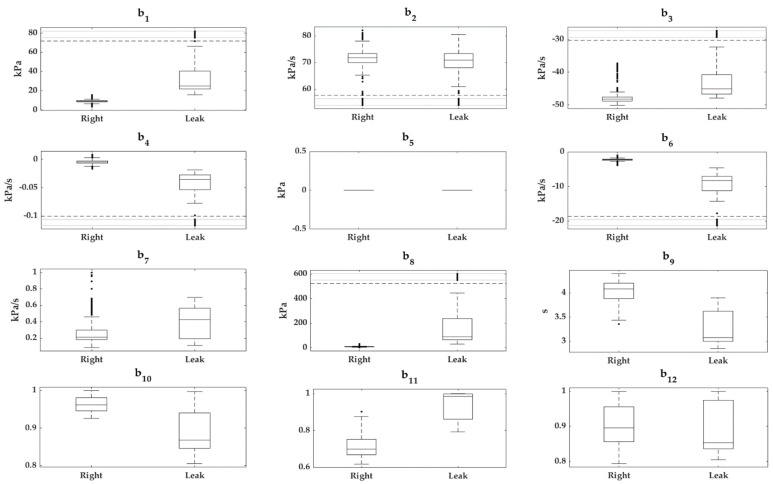
Figure 6.
Box-and-whisker plots of quantitative features extracted (b1–b12) from the bellows signals. The “Right” and “Leak” groups are represented for each feature; b13 is not presented due to its categorical nature. For additional information on the extracted features see Appendix A.

