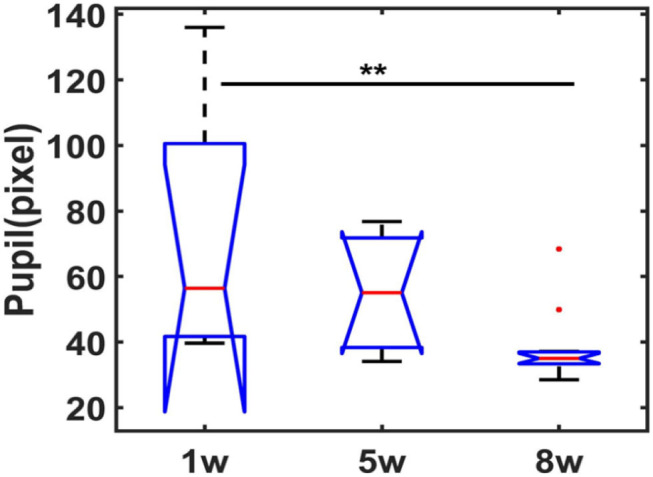
Figure 3.

Statistical analysis of pupil dynamics in resting-state following different weeks of training. Boxplot graph represents the pupil diameter changes (central red line is the median, 1w: 56.42, 5w: 55.08s, 8w: 35.04; interquartile range 25th and 75th percentiles denote the maximum and minimum, outliers are shown by red dots, ** p < 0.01, by Bonferroni post-hoc test, mean trials = 9 each week session, n = 3 animals).
