Figure 2.
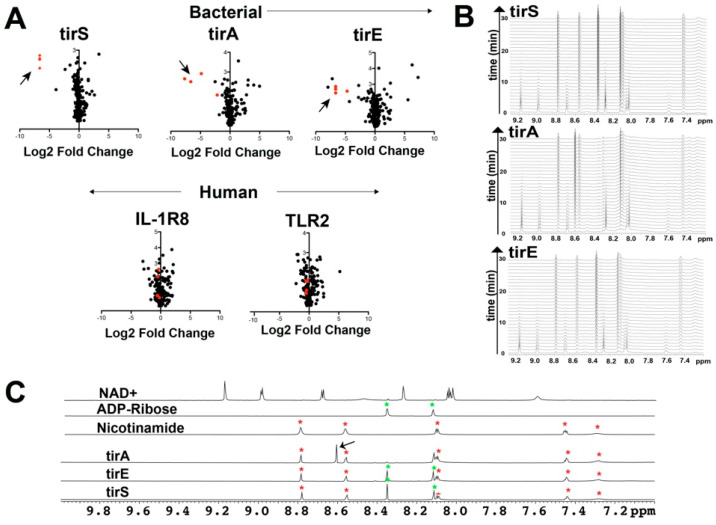
Characterizing TIR-containing catalytic activity. (A) Volcano plots derived from MS analysis are shown for 24 h incubations of 1 μM bacterial TIR proteins that include tirS, tirA, and tirE and mammalian TIR domains from IL-1R8 and TLR2 incubated in protein-depleted RBC extracts relative to a buffer control. Arrows delineate the reduction in NAD+, NADP+, NADH, and NADPH (red). (B) The time course of one-dimensional NMR spectra is shown for 1 mM NAD+ after incubation with 1 μM tirS, 43 μM tirA, and 25 μM tirE. (C) 1D-spectra of NAD+, ADP-ribose, and nicotinamide along with the product spectra of NAD+ incubated with tirS, tirA, and tirE. Resonances from ADP-ribose and nicotinamide are denoted green and red, respectively, while the arrow denotes the single difference within tirA.

