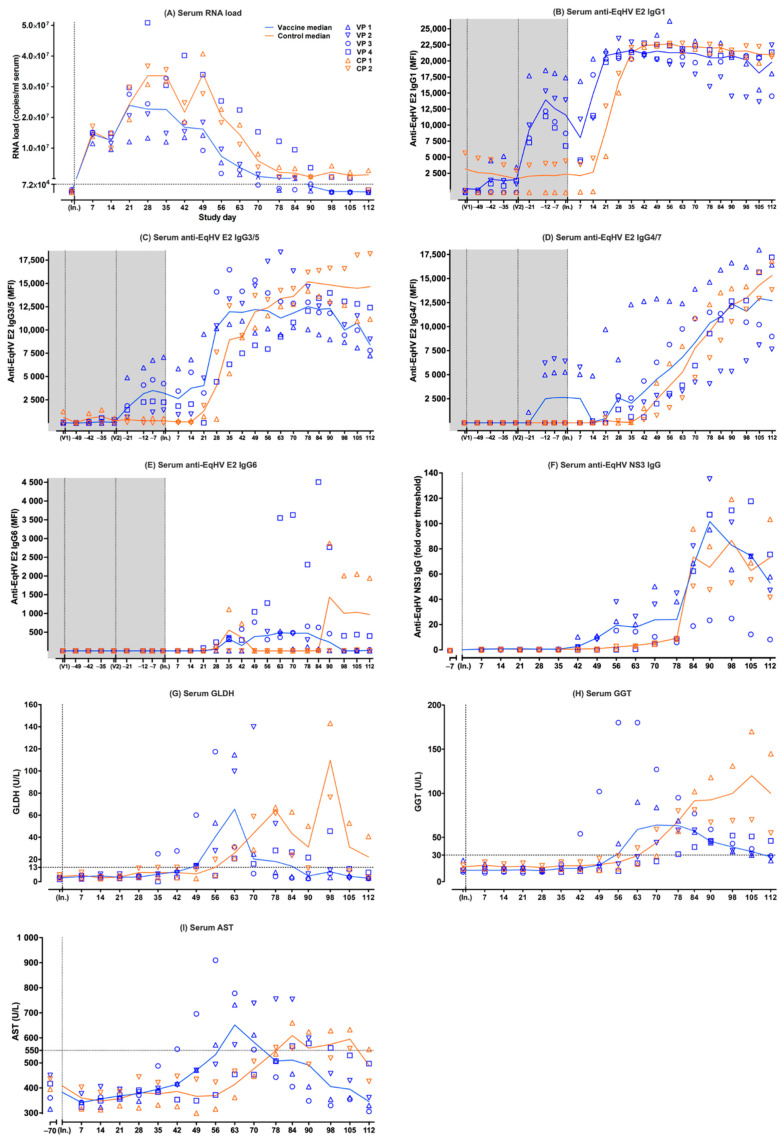
Figure 1.
Individual (symbols) and median (lines) values of parameters measured in serum samples of six experimental ponies over time. Data from the vaccine ponies (VP) are shown in blue and data from the control ponies (CP) are shown in orange. Prime (V1) and booster (V2) vaccinations were administered on day −55 and day −27, while viral inoculation (In.) occurred on day 0. The parameters measured were (A) serum EqHV RNA load (LLOQ of the EqHV qPCR = 7.2 × 10⁴ viral copies/mL of serum); (B) serum anti-EqHV E2 IgG1; (C) serum anti-EqHV E2 IgG3/5; (D) serum anti-EqHV E2 IgG4/7; (E) serum anti-EqHV E2 IgG6; (F) serum anti-EqHV NS3 IgG; (G) serum GLDH (reference < 13 U/L); (H) serum GGT (reference < 30 U/L); (I) serum AST (reference < 550 U/L). AST = aspartate aminotransferase; CP = Control Pony; EqHV = equine hepacivirus; GLDH = glutamate dehydrogenase; GGT = gamma-glutamyl transferase; IgG = immunoglobulin G; In. = viral inoculation; LLOQ = lower limit of quantitation; MFI = median fluorescent intensity; NS3 = nonstructural protein 3; RNA = ribonucleic acid; qPCR = quantitative polymerase chain reaction; V1 = vaccination 1; V2 = vaccination 2; VP = Vaccine Pony. In this figure, all serum EqHV RNA load values ≤ LLOQ (≤7.2 × 10⁴ viral copies/mL of serum) were indicated as ≤LLOQ. Serum AST baseline values were determined on day −70.

