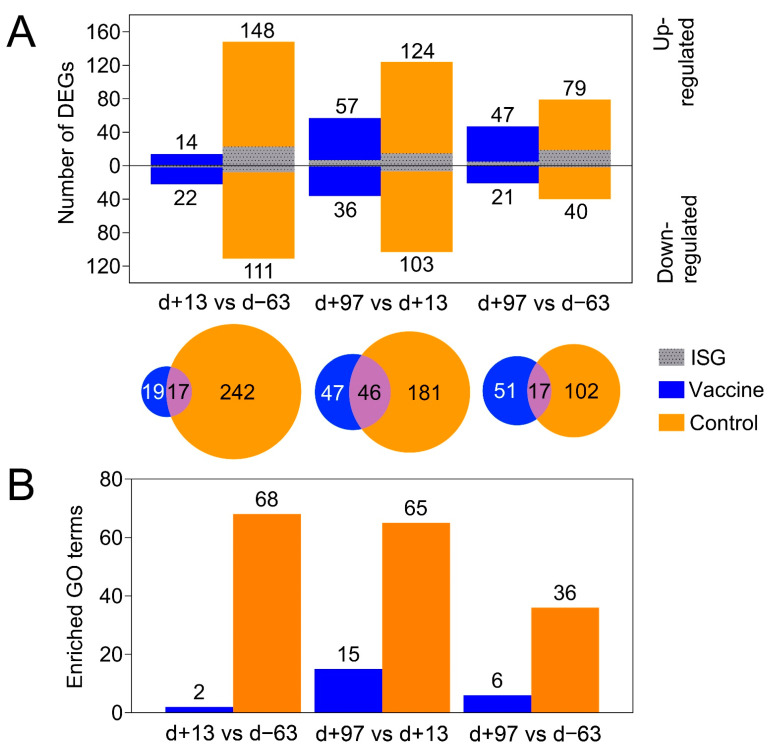
Figure 3.
(A) The number of differentially expressed genes (DEGs) in the vaccine ponies (excluding Vaccine Pony 4, blue) and control ponies (orange) based on pairwise data comparisons for liver biopsy time points (day +13 vs. day -63; day +97 vs. day +13; day +97 vs. day -63). For all pairwise analysis of biopsy samples taken at different times, comparison of the later time point was made with the earlier time point. DEGs that were also identified as interferon stimulated genes (ISGs) are shown in grey. (B) The number of enriched gene ontology (GO) terms from the category “biological process” (BP) identified in the vaccine ponies (excluding Vaccine Pony 4, blue) and control ponies (orange) based on pairwise data comparisons for liver biopsy time points as described above. d = day; DEG = differentially expressed gene; GO = gene ontology; ISG = interferon stimulated gene.

