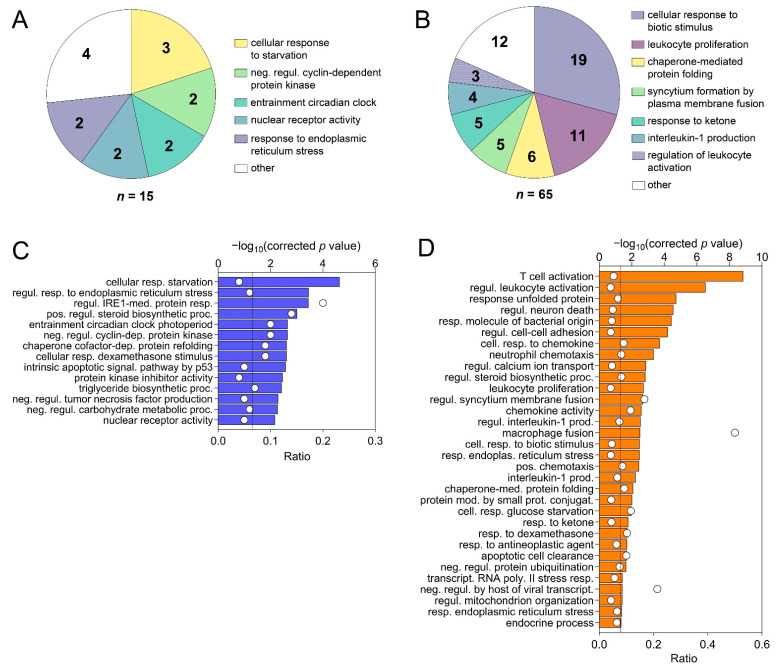
Figure 6.
Grouping of all enriched Gene Ontology (GO) terms based on the overlap of associated genes as calculated by the “GO term fusion” option in ClueGO. Groups were named after the term with the lowest level in GO hierarchy. Numbers indicate the count of GO terms for each group for (A) the vaccine ponies (excluding Vaccine Pony 4, n = 15 terms) and (B) the control ponies (n = 65 terms), based on comparison of liver biopsies during late and early equine hepacivirus (EqHV) infection (day +97 vs. day +13). Nonredundant GO terms as filtered by “REVIGO” for (C) the vaccine ponies (excluding Vaccine Pony 4, n = 14 terms) and (D) the control ponies (n = 32 terms) for the comparison described above (day +97 vs. day +13), listed in descending order of corrected p-value. White circles (C,D) represent the ratio of differentially expressed genes (DEGs) from the data set compared to the total number of genes associated with the respective GO terms.

