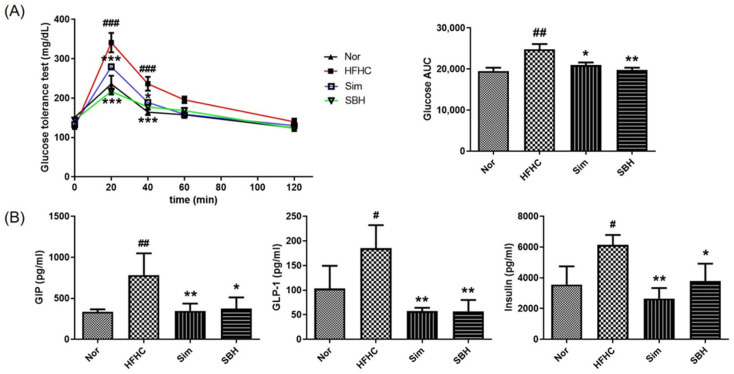
Figure 4.
Effects of SBH on glucose tolerance and plasma biomarker concentrations related to insulin secretion. Oral glucose tolerance test (OGTT) and fasting blood glucose levels in C57BL/6J mice were measured. The area under the curve (AUC) was determined using the trapezoidal rule (A). The levels of GIP, GLP-1, and insulin were measured using the Bio-Plex Pro Mouse Diabetes 8-plex Assay (B). The number of experiments: Nor (n = 4), HFHC (n = 4), Sim (n = 4), SBH (n = 4). Significant differences between the groups were assessed using two-way (A) or one-way (B) ANOVA with Tukey’s multiple comparison test. Data are expressed as the mean ± SEM. # p < 0.05, ## p < 0.01, ### p < 0.001 compared with Nor; * p < 0.05, ** p < 0.01, *** p < 0.001 compared with HFHC. Nor, normal control group; HFHC, high-fat and high-cholesterol diet group; Sim, HFHC diet plus Sim group; SBH, HFHC diet plus SBH group.

