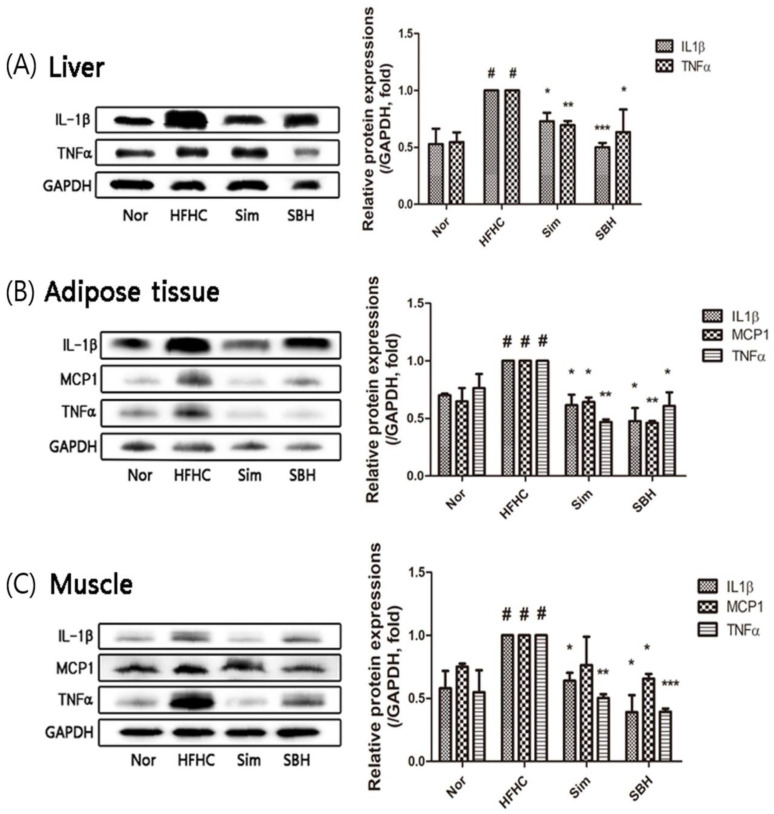
Figure 8.
Effects of SBH on the expression of inflammatory cytokines. Western blot analyses of IL-1β and TNFα in the liver (A) and IL-1β, TNFα, and MCP1 in the adipose (B) and muscle (C) tissues were performed. Densitometric quantification was expressed as a fold change in the ratio of protein expression/GAPDH (an internal control). The number of experiments: Nor (n = 3), HFHC (n = 3), Sim (n = 3), SBH (n = 3). Data are expressed as the mean ± SEM. # p < 0.05 compared with Nor; * p < 0.05, ** p < 0.01, *** p < 0.001 compared with HFHC. Nor, normal control group; HFHC, high-fat and high-cholesterol diet group; Sim, HFHC diet plus Sim group; SBH, HFHC diet plus SBH group.

