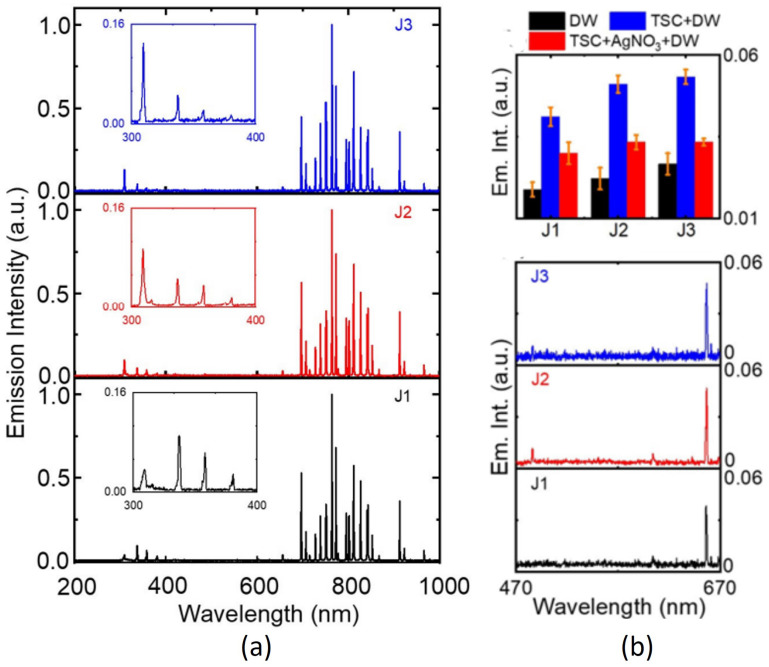
Figure 4.
(a) Optical emission spectra of the J1, J2, and J3 jets in the 200−1000 nm range. The 309 nm and 330–380 nm emission bands correspond to the hydroxyl radical and the second positive system transition of nitrogen molecules, respectively. (b) (top) Hydrogen emission intensities of , -, and -- treated for 10 min with the J1, J2, and J3 jets. (bottom) Hydrogen emission spectra of -- treated for 10 min with the J1, J2, and J3 jets.

