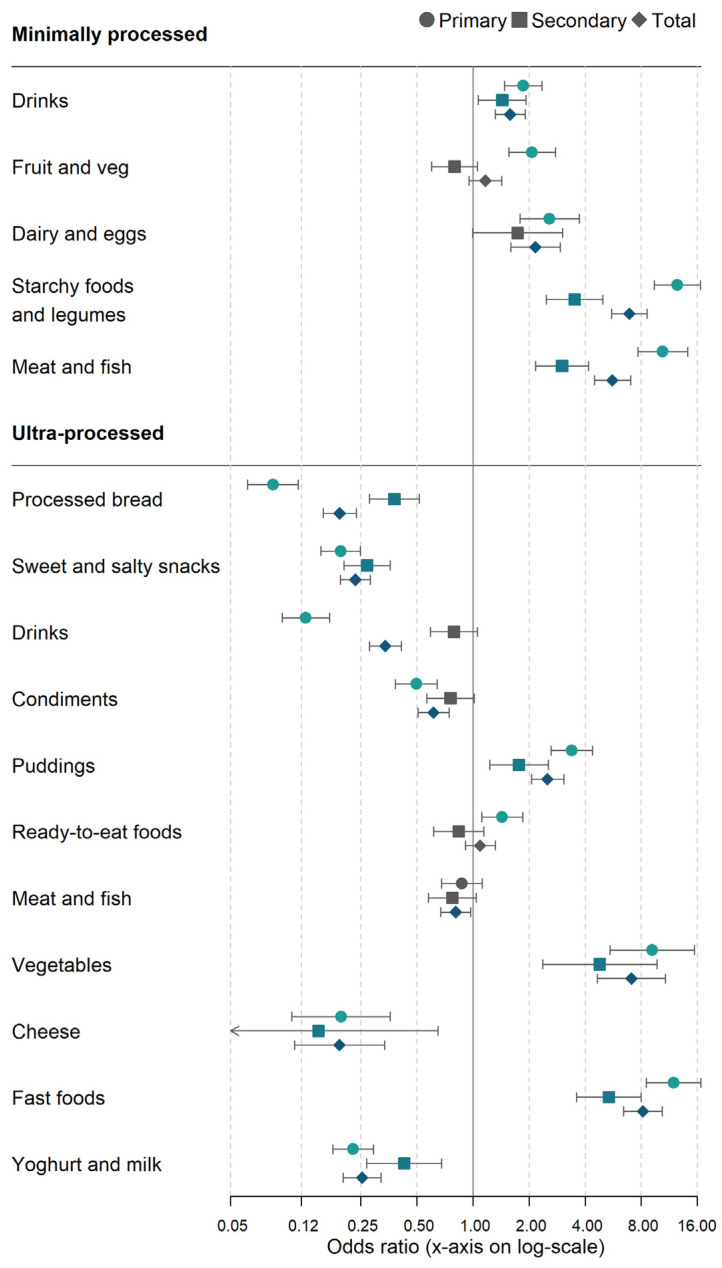
Figure 3.
Logistic regression of the likelihood of consuming minimally and ultra-processed food groups by meal type (school meals vs. reference of packed lunches) and school phase. Note: Fully adjusted regression model, covariates listed in Supplementary Table S3. Unprocessed drinks = water, juice etc; processed drinks = carbonated beverages; ultra-processed vegetables = baked beans and processed peas.

