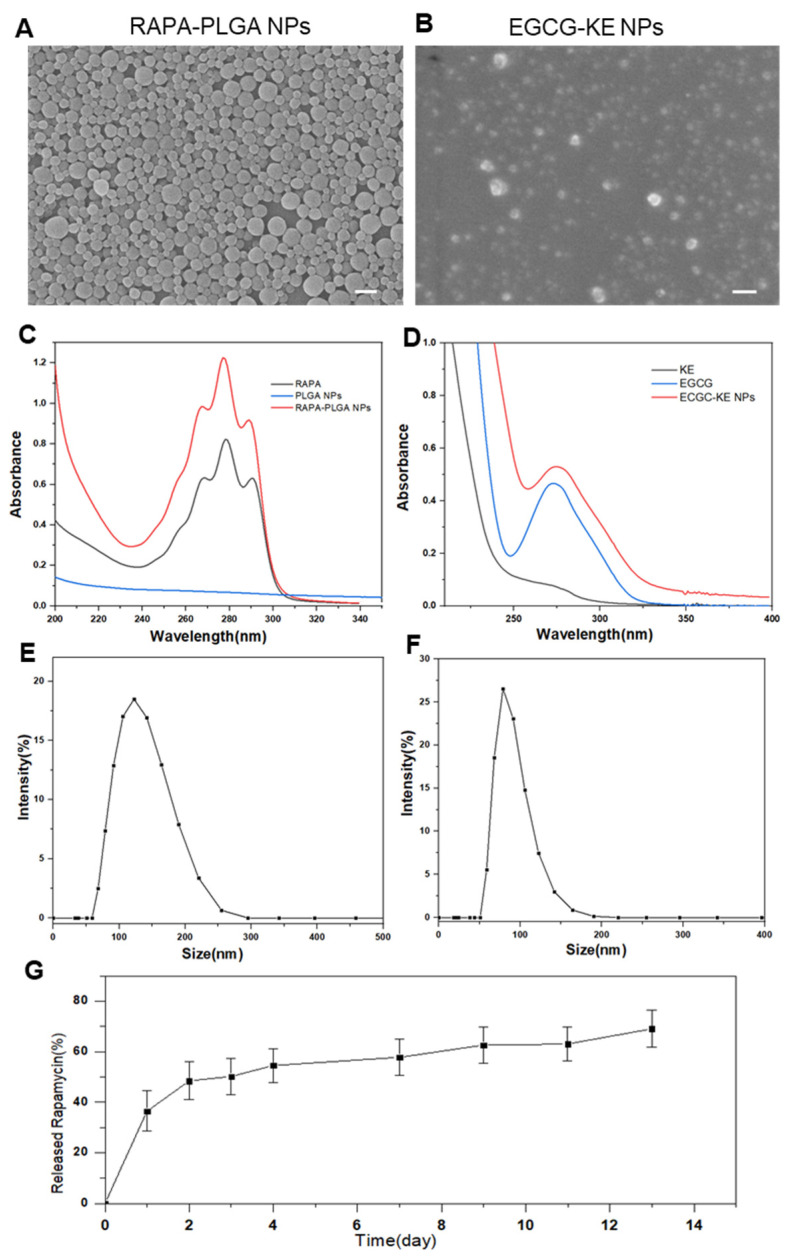
Figure 3.
Characterization of NPs. SEM image of PLGA-RAPA NPs (A) and EGCG-KE NPs (B). Scale bar: 200 nm. UV–vis of PLGA-RAPA NPs (C) and EGCG-KE NPs (D). Particle size distribution with a photograph of PLGA-RAPA NPs (E) and EGCG-KE NPs (F) in water. (G) In vitro release test of RAPA-PLGA NPs (n = 3, mean ± SD).

