Figure 3.
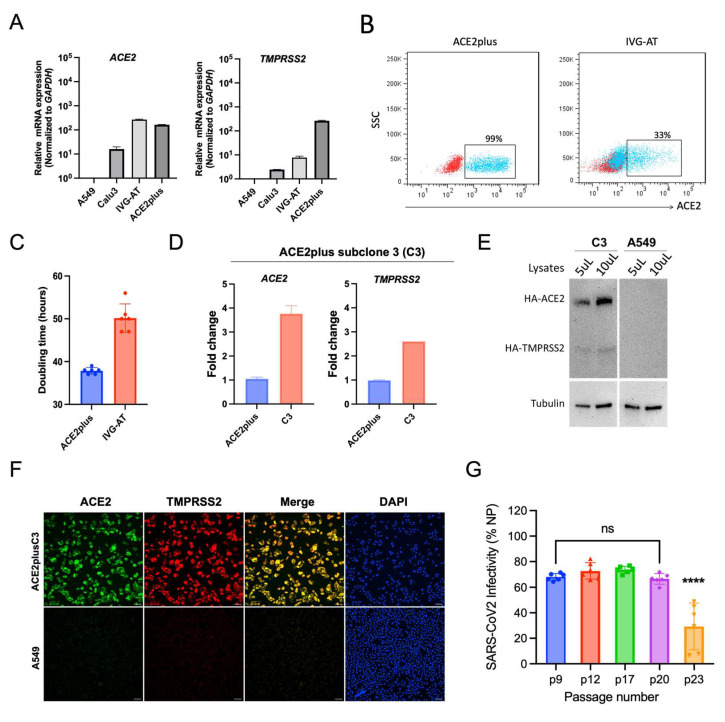
The characterization of the ACE2plus and ACE2plusC3 cell lines. The mRNA expression levels of ACE2 and TMPRSS2 in the indicated cell lines were measured with RT-qPCR (A,D). IVG-A and IVG-A/T commercial cell lines were used as comparators. (B) The cell surface ACE2 expression level was measured with flow cytometry using live cells. (C) The cell-doubling time was determined using a cell growth curve and Celigo Image software. (E) The protein expression levels of ACE2 and TMPRSS2 in cells were examined by immunoblotting and immunofluorescence staining (F). Scale bar, 100 μm. (G) The virus infectivity remains stable between early and late passages (p9, p12, p17, p20, and p23). ACE2plusC3 cells were infected with WT SARS-CoV-2 at an MOI of 0.1 for 48 h. Data are expressed as mean ± SD. n = 6 biological replicates. ns, not significant; ****, p < 0.0001.

